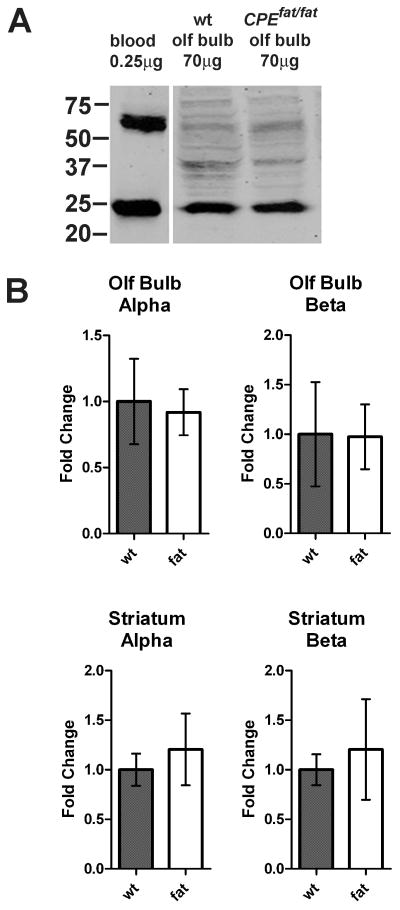
Figure 4.
Western blot analysis of hemoglobin protein levels in wild-type and Cpefat/fat mice. A: Representative data for alpha hemoglobin in olfactory bulb and blood. Hemoglobin monomer is seen at approximately 24 kD. B: Quantitation of results from multiple analyses. n= 5 Cpefat/fat mice and 6 WT mice. Error bars represent standard error of the mean.

