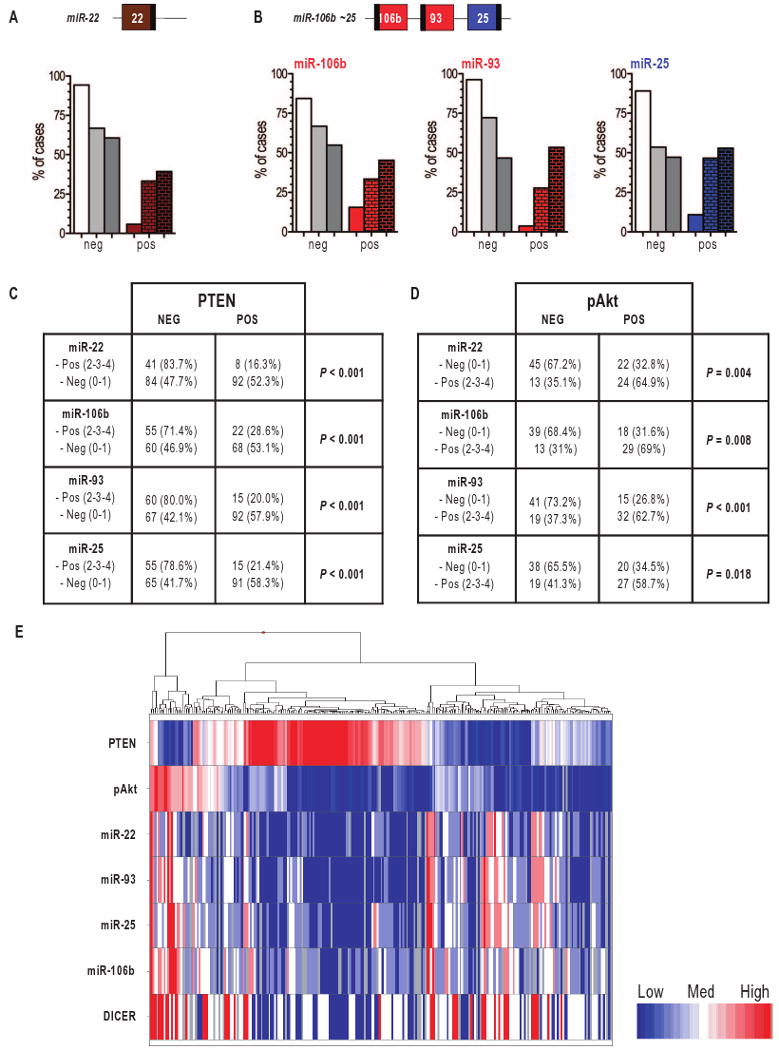
Fig. 4.

Presence of miR-22 and miR-106b∼25 miRNAs in human prostate tumor samples. (A and B) Score of the fractional presence of miR-22 (A) and miR-106b, miR-93 and miR-25 (B) in peritumoral tissue (left bars), PIN (middle bars), and prostate cancer (right bars), as detected by ISH. 0 to 1, negative (neg); 2 to 4: positive (pos). (C) Correlation between the lack of PTEN and the presence of miR-22 and miR-106b∼25 cluster miRNAs. (D) Correlation between the presence of pAkt and that of miR-22 and miR-106b∼25 cluster miRNAs. (E) Heat map of PTEN, pAkt, DICER, and miR-22/25/93/106b status in tumor samples. The heat map shows an inverse correlation between PTEN abundance and that of DICER, the miRNAs, and pAkt. The heat map was generated with TIBCO Spotfire Metrics (version 3.0) software.
