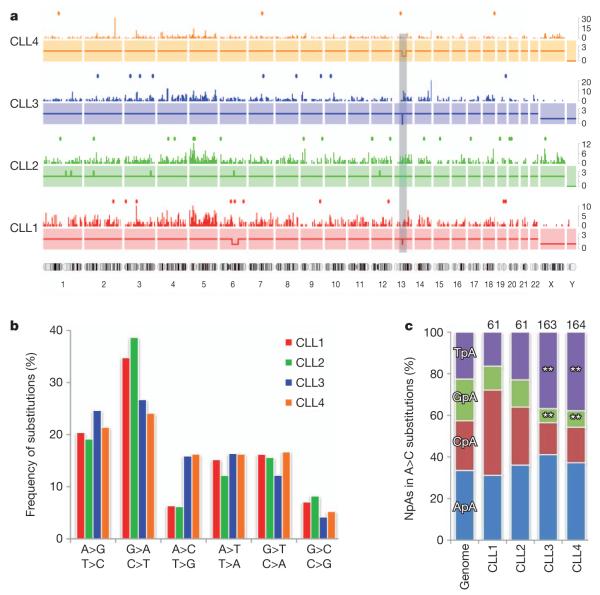
Figure 1. Profile of somatic mutations in four CLL genomes.
a, Distribution of somatic alterations. For each tumour genome, copy number (solid lines), density of mutations per 5-Mb window (bars) and protein-coding mutations (dots) are shown. The shaded rectangle indicates the location of the 13q14 deletion that was present in three of the four CLL cases. Chromosome numbers are listed below the four profiles. b, Frequency of substitutions in each CLL tumour for the six possible classes of mutation. c, Distribution of the four possible NpA dinucleotides for the A to C transversion in each tumour genome, compared with the expected distribution across the genome. The total number of A to C substitutions per case is indicated at the top (**, P < 0.001).

