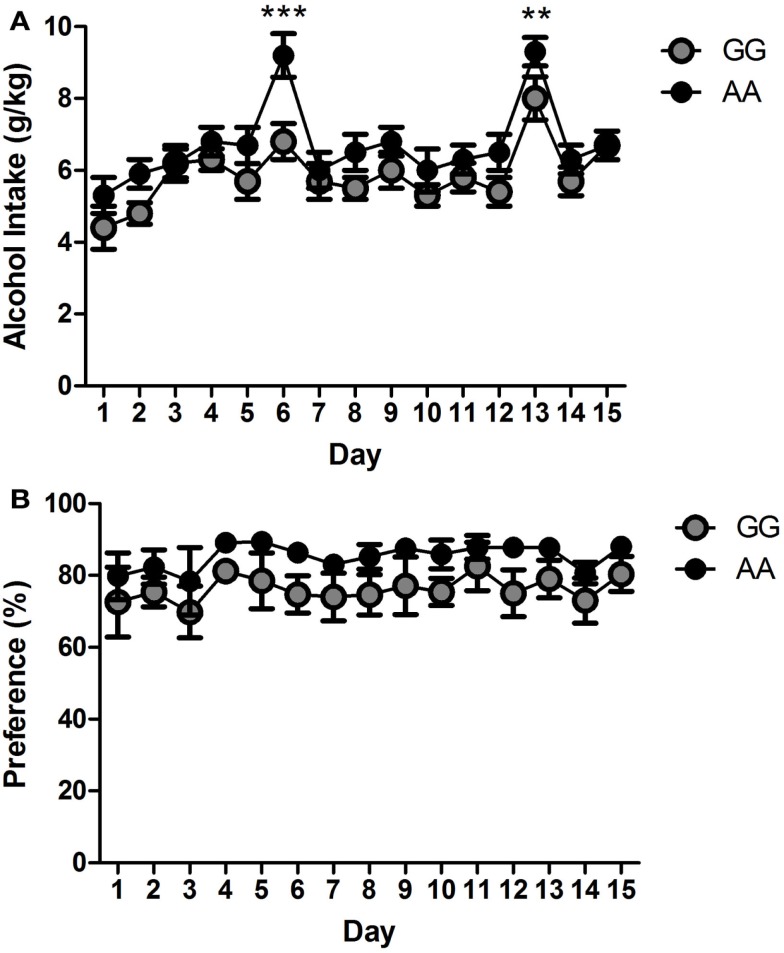
Figure 1.
Elevated alcohol drinking of the two msP lines GG (n = 8) and AA (n = 8) derived from the original msP line as assessed in the two-bottle free choice drinking paradigm. GG and AA msP rats show minimal changes in (A) drinking patterns and (B) alcohol preference across a period of 15 days. Values are presented as the daily mean g/kg of alcohol intake (±SEM) and percent (%) of alcohol preference (±SEM), respectively. **p < 0.01 and ***p < 0.001, significant difference between the two msP rat lines. GG: gray line; AA: black line. For detailed statistics, see “Results.”

