Abstract
Autophagy is a cellular catabolic process that relies on the cooperation of autophagosomes and lysosomes. During starvation, the cell expands both compartments to enhance degradation processes. We found that starvation activates a transcriptional program that controls major steps of the autophagic pathway, including autophagosome formation, autophagosome-lysosome fusion and substrate degradation. The transcription factor EB (TFEB), a master gene for lysosomal biogenesis, coordinated this program by driving expression of autophagy and lysosomal genes. Nuclear localization and activity of TFEB were regulated by serine phosphorylation mediated by the extracellular signal-regulated kinase 2, whose activity was tuned by the levels of extracellular nutrients. Thus, a mitogen-activated protein kinase-dependent mechanism regulates autophagy by controlling the biogenesis and partnership of two distinct cellular organelles.
Macro-autophagy is an evolutionary conserved mechanism that _targets intracytoplasmic material to lysosomes, thus providing energy supply during nutrient starvation (1, 2). Autophagy activation during starvation is negatively regulated by mammalian _target of rapamycin complex 1 (mTORC1), whose activity is dependent on cellular energy needs (3). The observation that starvation induced the transcription of several autophagy genes, whereas inhibition of mTORC1 did not, suggests the presence of alternative transcriptional mTORC1-independent regulation of autophagy (4, 5) (fig. S1, A and B).
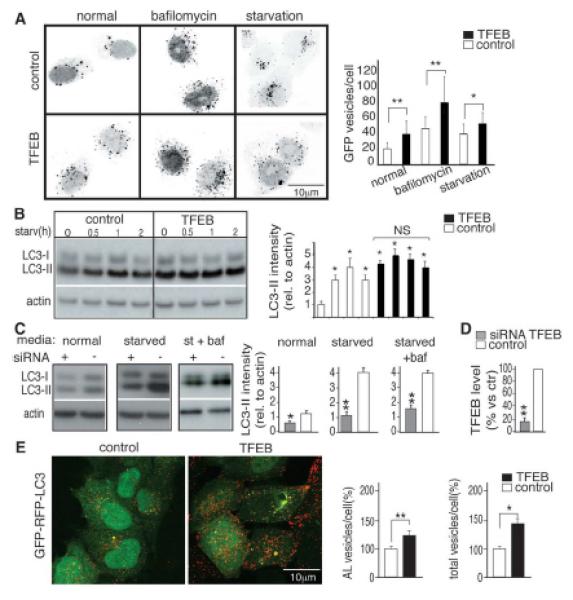
We tested whether TFEB, a transcription factor (“EB”) that controls lysosomal biogenesis by positively regulating genes belonging to the Coordinated Lysosomal Expression and Regulation (CLEAR) network, also regulated autophagy (6, 7). Stable TFEB overexpression in HeLa cells significantly increased the number of autophagosomes detected by immunofluorescence and immunoblotting of the LC3 protein, which specifically associates with autophagosomes (8) (Fig. 1, A and B). Similar data were obtained by transient overexpression of TFEB in HeLa and COS7 (monkey kidney fibroblast) cells (fig. S2, A to C) and from electron microscopy on mouse embryonic fibroblast (MEFs) infected with a lentivirus overexpressing TFEB (fig. S3, A to D). This increase persisted in cells treated with bafilomycin and pepstatin, as well as the cysteine proteinase inhibitor E64, which are lysosomal inhibitors of autophagosome and LC3-II degradation; the sustained increase indicated that TFEB activates the formation of autophagosomes (Fig. 1A and fig. S4, A and B).
Fig. 1.

TFEB induces autophagy. (A) Inverted color micrograph of control and stably overexpressing TFEB HeLa cells transfected with a GFP-LC3 plasmid and treated as follows: normal medium (normal), 2 hours of bafilomycin 400 nM (bafilomycin) and 2 hours in medium without nutrients (starvation); ~100 cells were analyzed for each treatment. Graph shows means of GFP-positive vesicles per cell. (B) Immunoblot analysis of LC3 in stable TFEB-overexpressing cells starved (Starv) for the indicated time (h, hours) represented as quantification of LC3-II intensity (relative to actin). (C) Cellular lysates isolated from TFEB-RNAi (+) and from scrambled RNAi-treated cells (–) cultured in normal medium, starved medium, or starved mediumsupplemented with bafilomycin (baf, 400 nM for 4 hours) as the quantification of LC3-II intensity (relative to actin). (D) TFEBmRNA levels from cells transfected with siRNA oligomers _targeting TFEB or a scrambled sequence (ctr). (E) Representative confocal images of fixed HeLa cells stably expressing GFP-mRFP-LC3 transfected with empty (control) or TFEB vector shown as the average of vesicles per cell relative to the control (%). Aminimum of 2000 cells was counted. AL (autolysosomes) = (mRFP-positive vesicles)/(GFP-negative vesicles); total, mRFP-positive vesicles. All values are means TSEM of at least three independent experiments. Student’s t test (unpaired); *P < 0.05, **P < 0.01.
RNA interference (RNAi) of TFEB in HeLa cells resulted in decreased levels of LC3-II both in normal and starved conditions, in either the presence or absence of bafilomycin (Fig. 1, C and D). The decrease of LC3-II correlated with the levels of TFEB down-regulation achieved by the different RNAi oligomers (fig. S4, C and D). These gain- and loss-of-function data suggest that the biogeneses of autophagosomes and lysosomes are co-regulated by TFEB. We next measured the rate of delivery of autophagosomes to lysosomes using an RFP-GFP (red fluorescent protein – green fluorescent protein) tandem tagged LC3 protein, which discriminates early autophagic organelles [GFP-positive and monomeric RFP (mRFP)-positive] from acidified autophagolysosomes (GFP-negative and mRFP-positive), because of quenching of the GFP signal (but not of mRFP) inside acidic compartments. The number of autophagolysosomes was higher in TFEB overexpressing cells than in control cells, which indicated that TFEB enhanced the autophagic flux (Fig. 1E). Consistently, degradation of long-lived proteins (9) was enhanced by TFEB overexpression and reduced by TFEB depletion (knock-down) (fig. S5A).
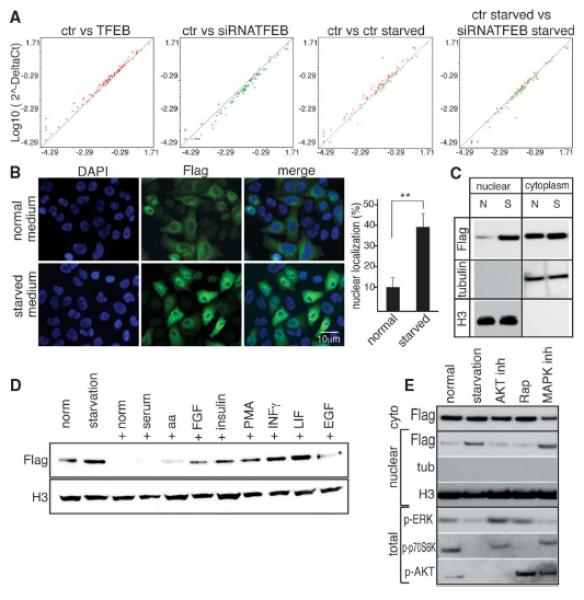
To test whether TFEB regulated the expression of autophagy genes, we analyzed the mRNA levels of a group of 51 genes reported to be involved in several steps of the autophagic pathway (1, 10, 11). The enhancement of the expression levels of autophagy genes in cells overexpressing TFEB was very similar to that of starved cells (Fig. 2A and table S1) [Pearson correlation coefficient (r) = 0.42; P = 0.001]. Eleven of the analyzed genes were significantly up-regulated after transient, stable and tetracycline-dependent TFEB expression, whereas they were down-regulated after TFEB silencing in both normal and starved conditions (Fig. 2A, fig. S5B, and tables S2 and S3). The expression of UVRAG, WIPI, MAPLC3B, SQSTM1, VPS11, VPS18 and ATG9B was most significantly affected by TFEB overexpression (tables S2 and S3). These genes are known to play a role in different steps of autophagy (fig. S6) and appeared to be direct _targets of TFEB because they carry at least one TFEB _target site (6) in their promoters (fig. S7). In addition, we validated the binding of TFEB to the _target sequence by quantitative chromatin immune-precipitation assay (QChip) and observed that this binding is further enhanced during starvation (fig. S8, A and B).
Fig. 2.

Starvation regulates TFEB nuclear translocation and activity. (A) The expression levels of 51 autophagy-related genes were compared in control and TFEB-overexpressing HeLa cells ultured under different conditions. The results were represented as scatter-plot graphs where circles represent genes with increased (red) or decreased (green) fold change (logarithmic value); x axis, control group; y axis, treated group. (B) Representative images of HeLa cells stably overexpressing TFEB cultured in normal or starved medium for 4 hours. Five fields containing 50 to 100 cells each from five independent experiments were analyzed for TFEB nuclear localization: nucleus, 4′,6′-diamidino-2-phenylindole (DAPI); TFEB, Flag. Values are means ± SEM; Student’s t test (unpaired) **P<0.01. (C) Cells were subjected to nuclear and/or cytosolic fractionation and blotted with antibody against Flag. H3 and tubulin were used as nuclear and cytosolic markers, respectively. (D) Starved cells were treated as indicated (EGF, epidermal growth factor; FGF, fibroblast growth factor; PMA, phorbol 12-myristate 13-acetate). Nuclear fractions were blotted with antibodies against Flag and H3 (loading control). (E) Immunoblot analysis of Flag, tubulin, and H3 in nuclear extracts prepared from normal, starved, and starved then stimulated cells in normal medium for 1 hour (normal) or pretreated with AKT inhibitor, rapamycin mTOR inhibitor, and MAPK inhibitors 1 hour before media stimulation. Total extracts were used to verify the efficiency of the inhibitors (p-ERK, phosphorylated ERK kinase; Rap, rapamycin).
In normal conditions, TFEB is localized to the cytoplasm (6). Nutrient starvation rapidly induced TFEB nuclear translocation (Fig. 2, B and C), and cytosolic TFEB from starved cells appeared to have a lower molecular weight compared to that of normally fed cells (fig. S9A). This molecular weight shift occurred rapidly but transiently, and was abolished within 1hour after we added back normal media to starved cells, concomitant with a decrease of nuclear TFEB (fig. S9A). After starvation medium was supplemented with serum, amino acids, or growth factors [i.e. insulin or epidermal growth factor (EGF)], TFEB nuclear translocation was inhibited compared with results from starvation medium alone (Fig. 2D), whereas no effect was observed with cytokines [i.e. interferon (INF) or leukemia inhibitory factor (LIF)] (Fig. 2D), which suggested that activation of TFEB is controlled by a signaling mechanism that is sensitive to nutrient and growth factors. We stimulated starved cells with normal medium supplemented with drugs inhibiting the mTORC, phosphatidylinositol 3-kinase-AKT (PI3K-AKT), and mitogen-activated protein kinases (MAPKs). MAPK inhibition resulted in TFEB nuclear localization, whereas AKT and mTOR inhibition had no effect (Fig. 2E and fig. S9B).
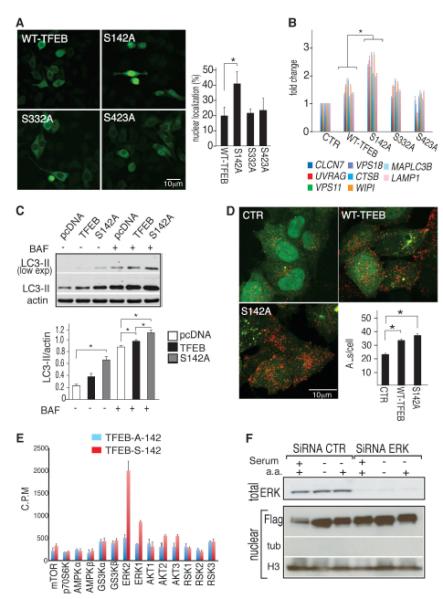
To analyze further the relationship between MAPK signaling and TFEB a nanoscale high-performance liquid chromatography-mass spectrometry (HPLC-MS/MS) analysis of phosphorylated peptide was carried out using advanced linear ion trap-orbitrap mass spectrometer which identified at least three peptides containing serines (Ser142, Ser332, and Ser402) that were phosphorylated in nutrient-rich medium but not in nutrient-lacking (starved) medium (fig. S10). We mutated each of these three serines to alanines to abolish phosphorylation, e.g., serine at 142 replaced by alanine written as S142A. Mutant TFEB proteins were individually expressed in HeLa cells and TFEB nuclear translocation was analyzed. The TFEB(S142A) mutant showed a significantly increased nuclear localization compared with TFEB(WT) (wild-type), TFEB(S332A) and TFEB(S402A) (Fig. 3A and fig. S11A). Conversely, the phosphomimetic mutant [(TFEB(S142D)] was unable to translocate into the nucleus when cells were nutrient-starved (fig. S11B). When starved the S142A TFEB mutant did not show a mobility shift compared with TFEB(WT), whereas the S142D mutant did (fig. S11, C and D). The expression of TFEB(S142A) resulted in increased expression levels of TFEB _target genes compared with TFEB(WT), TFEB(S332A) and TFEB(S402A) (Fig. 3B). Consistently, TFEB(S142A) caused a stronger induction of the autophagic-lysosomal system, compared with WT-TFEB, as demonstrated by the increased number of autophagosomes (Fig 3C and fig. S12A), lysosomes (fig S12B) and autophagolysosomes (Fig. 3D).
Fig. 3.

Serine phosporylation regulates TFEB activation. (A) Flag immunostaining of TFEB subcellular localization in HeLa cells expressing mutated versions of TFEB-3xFlag. Five fields from three independent experiments, containing 50 to 100 cells each were analyzed. (B) Quantitative polymerase chain reaction (QPCR) analysis of TFEB _target gene expression 24 hours after transfection with empty, normal, and mutant TFEB plasmids. (C) Immunoblot analysis of LC3-II in protein extracts from HeLa cells transfected with equal amounts of empty (pcDNA), WT-TFEB, or TFEBS142A-3xFlag vectors. Bafilomycin was added where indicated (400 nM for 4 hours). Quantification of LC3-II level was normalized to actin levels. (D) Analysis of autophagolysosomes (AL = RFP positive/GFP negative) in HeLa cells stably expressing GFP-mRFP-LC3 and transfected with pcDNA, WT-TFEB or TFEBS142A-3xFlag for 24 hours before harvesting. (E) In vitro kinase assay. Recombinant kinases were incubated in the presence of [γ-32P]adenosine triphosphate and of a peptide spanning amino acids 120 to 170 of TFEB protein (TFEB-S-142) or with a similar peptide in which serine 142 was replaced with alanine (TFEB-A-142). Phosphorylation efficiency was measured as the amount of radioactivity incorporated by the peptides. (F) HeLa stable clones overexpressing TFEB were transfected with siRNA oligomers specific for ERK1/2 or with control siRNA. After 48 hours, cells were left untreated, serum-starved, or serum- and amino acid (a.a.)– starved for 4 hours; harvested; and subjected to nuclear isolation and Flag and H3 immunoblotting. Total lysates were probed with ERK-specific antibody. Values are means ± SEM of at least three independent experiments. Student’s t test (unpaired) *P < 0.05, **P < 0.001.
Bioinformatic analysis (12-16) was performed to identify the specific kinase responsible for the phosphorylation of serine 142 (7). We identified the serine-specific extracellular regulated kinases (ERKs), belonging to the MAPK pathway (17), as the top-ranking candidates for the phosphorylation of serine 142 (table S4). Serine 142 is highly conserved in other members of the helix-loop-helix leucine zipper gene family such as the microphthalmia transcription factor (fig. S13), which is phosphorylated by ERK2 (18). Evidence for ERK2-mediated TFEB phosphorylation came from ERK2-TFEB coimmuno-precipitation (fig. S12C) in normal but not in starved medium and from a peptide-based kinase assay showing that mutation of Ser142 to alanine abolished ERK2-mediated phosphorylation (Fig. 3E and table S5). Small interfering RNA (siRNA)-mediated knock-down of ERK1/2 proteins induced TFEB nuclear translocation to a similar extent as serum starvation (Fig. 3F). Furthermore, the expression of constitutively active MEK in HeLa cells resulted in down-regulation of TFEB _target gene expression during starvation and this effect was similar whether TFEB was knocked down or not (fig. S14A).
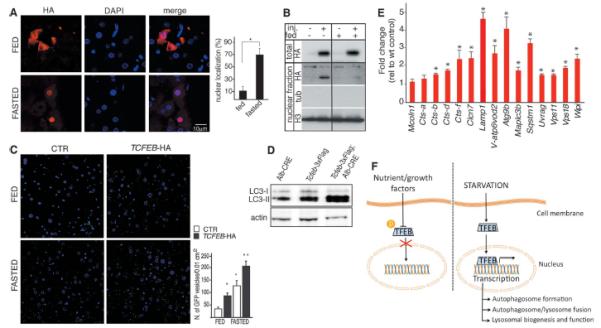
We analyzed the TFEB-mediated control of the lysosomal-autophagic pathway in the liver of GFP-LC3 transgenic mice (19, 20). The number of GFP-positive vesicles started to increase after 24 hours of fasting (fig. S14B), whereas the transcriptional induction of both autophagic and lysosomal TFEB _target genes was evident after 16 hours of fasting (fig. S14C), when the subcellular localization of TFEB was completely nuclear (Fig. 4, A and B) and the level of ERK phosphorylation was reduced compared with fed animals (fig. S14D). GFP-LC3 transgenic mice (19) were also injected systemically with an adeno-associated virus (AAV) vector containing the murine Tcfeb cDNA tagged with a hemagglutinin (HA) epitope (AAV 2/9–Tcfeb-HA) (fig. S15, A and B). Liver specimens from Tcfeb-injected animals showed a significant increase in the number of GFP-positive vesicles, and this increase was further enhanced by starvation (Fig. 4C and fig. S14D). In addition, liver samples from conditional Tcfeb-3xFlag (tagged three times with the Flag epitope) transgenic mice, in which transgene expression is driven by a liver-specific cyclic adenosine monophosphate response element (CRE) recombinase (i.e. albumin-CRE) (fig. S15C), displayed a significant increase in the number autophagosomes and in the expression of lysosomal and autophagic genes compared with control littermates (Fig. 4, D and E). Thus TFEB is involved in the transcriptional regulation of starvation-induced autophagy.
Fig. 4.

In vivo analysis of TFEB-mediated induction of autophagy. (A and B) Analysis of TFEB subcellular localization in 2-month-old WT mice infected with AAV2/9 Tcfeb-HA and fasted 16 hours before being killed. (A) Quantification of nuclear HA signal. HA-immunofluorescence analysis (red) and DAPI staining (blue); 100 transduced cells were counted for each liver. (B) Immunoblot analysis of HA, tubulin, and H3 in liver specimens subjected to nuclear fractionation. Total liver lysates were probed with an HA-specific antibody to verify comparable transgene expression between fed and fasted animals. (C) Immunofluorescence of GFP and DNA (DAPI) staining in cryopreserved liver slices from 2-month-old GFP-LC3 transgenic mice injected with either AAV-Tcfeb-HA or saline solution (control group) and fed ad libitum or fasted for 24 hours before being killed. Quantification of GFP-positive vesicles is shown in the graph. (D) Immunoblot analysis of LC3 and actin in liver protein extracts from Alb-CRE, Tcfeb-3xFlag, and Tcfeb-3xFlag; Alb-CRE mice. (E) QPCR analysis of both autophagic and lysosomal TFEB _target gene expression in liver samples isolated from Alb-CRE, Tcfeb-3xFlag, and Tcfeb-3xFlag;Alb-CRE mice. (F) Model of phosphodependent TFEB regulation of the autophagic-lysosomal network during nutrient starvation. Values are means ± SEM; at least five mice per group were analyzed; *P < 0.05, **P < 0.001.
Both transcriptional-dependent (4, 5, 21) and independent mechanisms regulating autophagy have been described (22-24). Here we have identified a novel transcriptional mechanism that controls multiple crucial steps of the autophagic pathway and may ensure a prolonged and sustained activation of autophagy (Fig. 4F). Autophagy dysfunction has been linked to several genetic disorders (25-27) and enhancement of autophagy was shown to have a therapeutic effect in animal models (28-30). Hence, the discovery of a novel mechanism that controls the lysosomal-autophagic pathway suggests novel approaches to modulate cellular clearance.
Supplementary Material
Acknowlegements
We thank H. Bellen, A. De Matteis, G. Diez-Roux, M Ferron, G. Karsenty, A. Luini and H. Zoghbi for critical reading of the manuscript; R. Polishchuck for technical advice with the electron microscopy; K. Moreau, M. Renna, A. Ronza, M. Palmieri for their contribution; and L. Naldini for the lentivirus production. We acknowledge the support of the Italian Telethon Foundation (C.S, C.D.M, V.P, M.S and A.B); the Beyond Batten Disease Foundation (C.S, C.D.M, V.P, S.U.E, T.H, M.S and A.B); the European Research Council Advanced Investigator grant number # 250154 (A.B); a European Molecular Biology Organization long-term fellowship (C.S); a Wellcome Trust Senior Research Fellowship (D.C.R); and a U.K. Medical Research Council programme grant (D.C.R). We wish to thank Cherie and James C. Flores for their generous donation. We also thank S.Tooze for GFP-LC3 cells, T Yoshimori for the RFP-GFP, P.Pandolfi for the HA-ERK2 and ca-MEK; M. Krentz for the CAG-lox-LacZ plasmid and for the useful suggestions during transgene generation; and the TIGEM AAV vector core for virus production. Confocal microscopy was supported by the Intellectual and Developmental Disabilities Research Center at the Baylor College of Medicine (5 P30 HD024064)
References and Notes
- 1.He C, Klionsky DJ. Annu Rev Genet. 2009;43:67. doi: 10.1146/annurev-genet-102808-114910. [DOI] [PMC free article] [PubMed] [Google Scholar]
- 2.Lum JJ, et al. Cell. 2005;120:237. doi: 10.1016/j.cell.2004.11.046. [DOI] [PubMed] [Google Scholar]
- 3.Sengupta S, Peterson TR, Sabatini DM. Mol Cell. 2010;40:310. doi: 10.1016/j.molcel.2010.09.026. [DOI] [PMC free article] [PubMed] [Google Scholar]
- 4.Mammucari C, et al. Cell Metab. 2007;6:458. doi: 10.1016/j.cmet.2007.11.001. [DOI] [PubMed] [Google Scholar]
- 5.Zhao J, et al. Cell Metab. 2007;6:472. doi: 10.1016/j.cmet.2007.11.004. [DOI] [PubMed] [Google Scholar]
- 6.Sardiello M, et al. Science. 2009;325:473. doi: 10.1126/science.1174447. [DOI] [PubMed] [Google Scholar]
- 7.Materials and methods are available as supporting material on Science Online.
- 8.Mizushima N, Yoshimori T, Levine B. Cell. 2010;140:14. doi: 10.1016/j.cell.2010.01.028. [DOI] [PMC free article] [PubMed] [Google Scholar]
- 9.Bauvy C, Meijer AJ, Codogno P. Methods Enzymol. 2009;452:47. doi: 10.1016/S0076-6879(08)03604-5. [DOI] [PubMed] [Google Scholar]
- 10.Mizushima N. Genes Dev. 2007;21:2861. doi: 10.1101/gad.1599207. [DOI] [PubMed] [Google Scholar]
- 11.Behrends C, Sowa ME, Gygi SP, Harper JW. Nature. 2010;466:68. doi: 10.1038/nature09204. [DOI] [PMC free article] [PubMed] [Google Scholar]
- 12.Dang TH, Van Leemput K, Verschoren A, Laukens K. Bioinformatics. 2008;24:2857. doi: 10.1093/bioinformatics/btn546. [DOI] [PMC free article] [PubMed] [Google Scholar]
- 13.Xue Y, et al. Mol Cell Proteomics. 2008;7:1598. doi: 10.1074/mcp.M700574-MCP200. [DOI] [PMC free article] [PubMed] [Google Scholar]
- 14.Amanchy R, et al. Nat Biotechnol. 2007;25:285. doi: 10.1038/nbt0307-285. [DOI] [PubMed] [Google Scholar]
- 15.Linding R, et al. Cell. 2007;129:1415. doi: 10.1016/j.cell.2007.05.052. [DOI] [PMC free article] [PubMed] [Google Scholar]
- 16.Gnad F, et al. Genome Biol. 2007;8:R250. doi: 10.1186/gb-2007-8-11-r250. [DOI] [PMC free article] [PubMed] [Google Scholar]
- 17.Kolch W. Nat Rev Mol Cell Biol. 2005;6:827. doi: 10.1038/nrm1743. [DOI] [PubMed] [Google Scholar]
- 18.Hemesath TJ, Price ER, Takemoto C, Badalian T, Fisher DE. Nature. 1998;391:298. doi: 10.1038/34681. [DOI] [PubMed] [Google Scholar]
- 19.Mizushima N, Yamamoto A, Matsui M, Yoshimori T, Ohsumi Y. Mol Biol Cell. 2004;15:1101. doi: 10.1091/mbc.E03-09-0704. [DOI] [PMC free article] [PubMed] [Google Scholar]
- 20.Rabinowitz JD, White E. Science. 2010;330:1344. doi: 10.1126/science.1193497. [DOI] [PMC free article] [PubMed] [Google Scholar]
- 21.Yang JY, et al. Nat Cell Biol. 2008;10:138. doi: 10.1038/ncb1676. [DOI] [PMC free article] [PubMed] [Google Scholar]
- 22.He C, Levine B. Curr Opin Cell Biol. 2010;22:140. doi: 10.1016/j.ceb.2010.01.001. [DOI] [PMC free article] [PubMed] [Google Scholar]
- 23.Kim J, Kundu M, Viollet B, Guan KL. Nat Cell Biol. 2011;13:132. doi: 10.1038/ncb2152. [DOI] [PMC free article] [PubMed] [Google Scholar]
- 24.Egan DF, et al. Science. 2011;331:456. doi: 10.1126/science.1196371. [DOI] [PMC free article] [PubMed] [Google Scholar]
- 25.Wong E, Cuervo AM. Nat Neurosci. 2010;13:805. doi: 10.1038/nn.2575. [DOI] [PMC free article] [PubMed] [Google Scholar]
- 26.Settembre C, et al. Hum Mol Genet. 2008;17:119. doi: 10.1093/hmg/ddm289. [DOI] [PubMed] [Google Scholar]
- 27.Settembre C, et al. Genes Dev. 2008;22:2645. doi: 10.1101/gad.1711308. [DOI] [PMC free article] [PubMed] [Google Scholar]
- 28.Hidvegi T, et al. Science. 2010;329:229. doi: 10.1126/science.1190354. [DOI] [PubMed] [Google Scholar]
- 29.Levine B, Kroemer G. Cell. 2008;132:27. doi: 10.1016/j.cell.2007.12.018. [DOI] [PMC free article] [PubMed] [Google Scholar]
- 30.Ravikumar B, Rubinsztein DC. Neuroreport. 2004;15:2443. doi: 10.1097/00001756-200411150-00001. [DOI] [PubMed] [Google Scholar]
Associated Data
This section collects any data citations, data availability statements, or supplementary materials included in this article.


