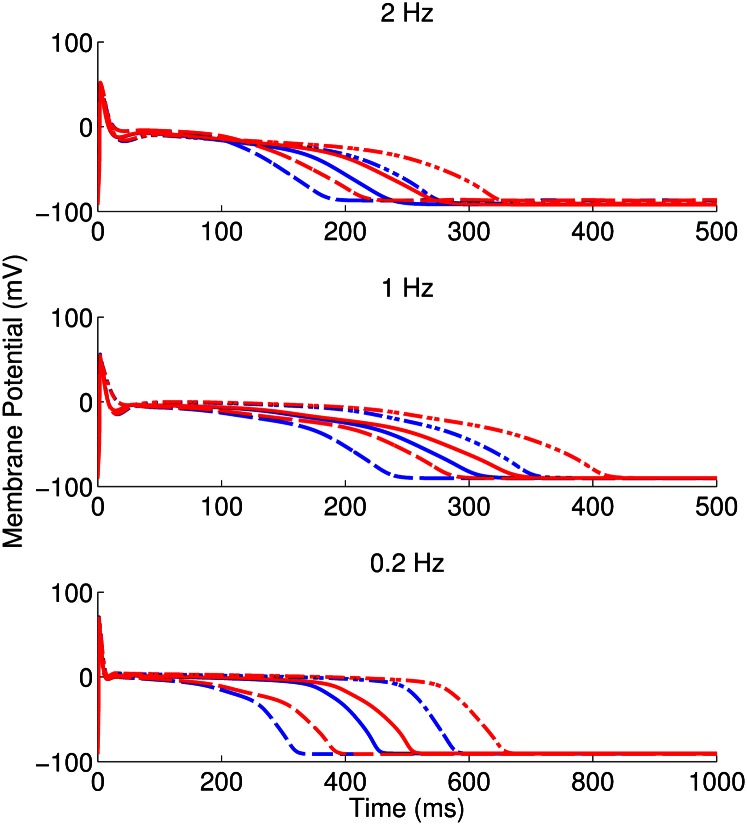
Fig. 6.
Simulated AP traces obtained for three representative models accepted in the population in control conditions (blue) and following application of 0.01 μM concentration of dofetilide (red) at 2-, 1-, and 0.2-Hz pacing frequencies. This is the concentration closest to the experimentally determined IC50 (therapeutic dose) for dofetilide (0.0124 μM). Plots extend to 500 ms for 2 and 1 Hz and 1,000 ms for 0.2 Hz. Line style indicates which of the control and dofetilide traces correspond to each model.

