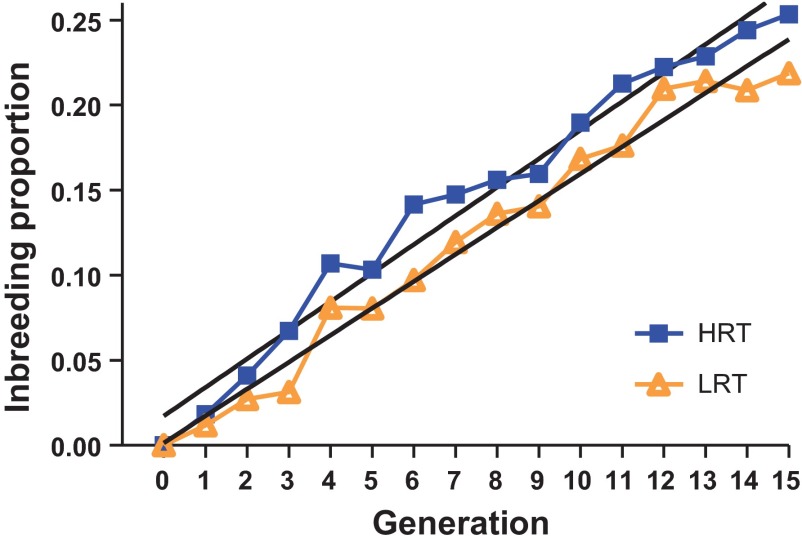
Fig. 5.
Level of inbreeding across 15 generations of selection (population 3). Mean inbreeding proportions are shown for LRT (light, diamond symbols) and HRT (dark, box symbols) lines. Fitting a linear regression model showed inbreeding increasing at an average rate of 0.017 and 0.016 per generation for the HRT and LRT lines, respectively.

