Figure 4.
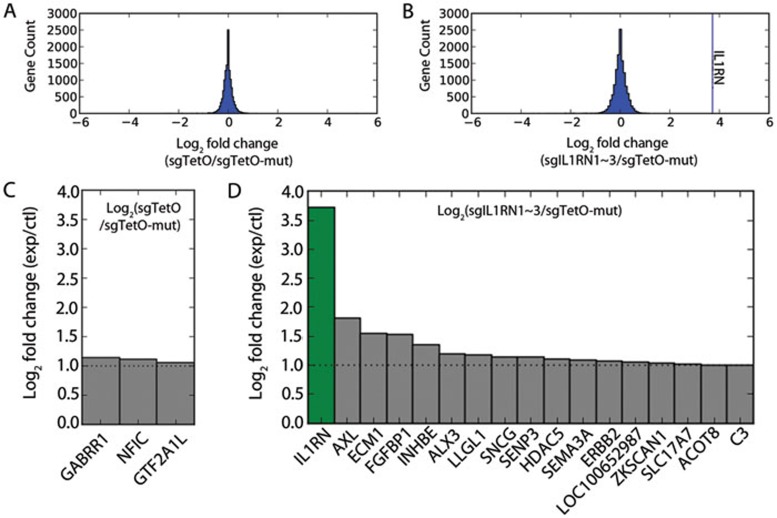
Genome-wide expression analysis of cells transfected with the CRISPR-on system. (A) The histogram showing distribution of Log2 fold changes of gene expression in sample transfected with dCas9VP160/sgTetO over dCas9VP160/sgTetO-mut control. (B) A histogram showing distribution of log2 fold changes of gene expression in cells transfected with dCas9VP160/sgIL1RN1∼3 over dCas9VP160/sgTetO-mut control. Vertical line marks the fold change of the _target gene IL1RN. (C) Column graph showing the Log2 fold changes of genes upregulated by at least 2-fold in cells transfected with dCas9VP160/sgTetO over dCas9VP160/sgTetO-mut. (D) Column graph showing the Log2 fold changes of genes upregulated by more than 2-fold in cells transfected with dCas9VP160/sgIL1RN1∼3 over dCas9VP160/sgTetO-mut. Dotted line indicates the 2-fold cut-off.

