Abstract
Somatic mutations in the small GTPase K-Ras are the most common activating lesions found in human cancer, and are generally associated with poor response to standard therapies1–3. Efforts to _target this oncogene directly have faced difficulties owing to its picomolar affinity for GTP/GDP4 and the absence of known allosteric regulatory sites. Oncogenic mutations result in functional activation of Ras family proteins by impairing GTP hydrolysis5,6. With diminished regulation by GTPase activity, the nucleotide state of Ras becomes more dependent on relative nucleotide affinity and concentration. This gives GTP an advantage over GDP7 and increases the proportion of active GTP-bound Ras. Here we report the development of small molecules that irreversibly bind to a common oncogenic mutant, K-Ras(G12C). These compounds rely on the mutant cysteine for binding and therefore do not affect the wild-type protein. Crystallographic studies reveal the formation of a new pocket that is not apparent in previous structures of Ras, beneath the effector binding switch-II region. Binding of these inhibitors to K-Ras(G12C) disrupts both switch-I and switch-II, subverting the native nucleotide preference to favour GDP over GTP and impairing binding to Raf. Our data provide structure-based validation of a new allosteric regulatory site on Ras that is _targetable in a mutant-specific manner.
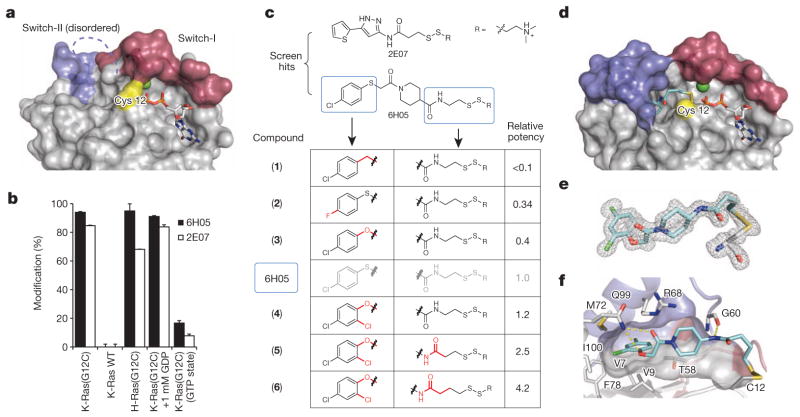
To _target K-Ras(G12C) we took advantage of the unique nucleophilicity of cysteine thiols by exploring cysteine-reactive small molecules. This strategy has the added advantage of allowing selectivity for the mutant over wild-type K-Ras. Notably, the mutant Cys 12 sits in close proximity to both the nucleotide pocket and the switch regions involved in effector interactions (Fig. 1a). To identify a chemical starting point, we used a disulphide-fragment-based screening approach called tethering8. We screened a library of 480 tethering compounds against K-Ras(G12C) in the GDP state using intact protein mass spectrometry9,10 (see Methods and Extended Data Table 1). Fragments 6H05 (94 ± 1% (mean ± s.d.)) and 2E07 (84.6± 0.3%)gave the greatest degree of modification (Fig. 1b, c). Reaction with wild-type K-Ras, which contains three native cysteine residues, was not detected. Conversely, both compounds modify the oncogenic G12C mutant of the highly homologous protein H-Ras11,12 (Fig. 1b). Binding was not diminished by 1 mM GDP in the presence of EDTA, suggesting that the compounds bind in an allosteric site not overlapping with GDP. Pre-loading of K-Ras with GTP significantly impairs modification by both compounds, indicating incompatibility between compound binding and the active conformation of Ras.
Figure 1. Tethering compounds selectively bind to oncogenic K-Ras(G12C).
a, Crystal structure of K-Ras(G12C) GDP shows Cys 12 (yellow), switch-I (red) and switch-II (blue). Switch-II is partially disordered. b, Percentage modification by compounds 6H05 and 2E07 (n = 3, error bars denote s.d.). c, 6H05 analogue structure–activity relationship. Relative potency = (fragment DR50)/(6H05 DR50), in which DR50 denotes the dose ratio resulting in 50% modification; see Methods. d, Co-crystal structure of 6 (cyan) and K-Ras(G12C) with GDP (grey) and Ca2+ (green). e, Fo − Fc omit map (grey mesh, 2.5σ) of 6 and Cys 12 from d. f, Surface representation of S-IIP around 6 showing hydrogen bonds (yellow lines). Indicated residues make hydrophobic contacts with 6.
We chose to pursue the top fragment, 6H05, by investigating structure–activity relationships for several analogues8 (Fig. 1c, see Methods). Some changes such as replacing the thioether with a methylene group reduced binding (1, relative potency <0.1). However, other changes such as modification of the tethering linker enhanced binding (6, relative potency 4.2). Having identified a tractable chemotype, we pursued a co-crystal structure to enable structure-based design. To facilitate uniform labelling on Cys 12 we used a K-Ras construct lacking other cysteines, K-Ras(C51S/C80L/C118S) (known as Cys-light), which showed minimal effects on overall protein structure (G12C versus Cys-light, root mean squared deviation (r.m.s.d.) (Cα) = 0.33 Å). Using this construct, we obtained a 1.29 Å co-crystal structure of 6 bound to K-Ras(G12C) in the GDP state (Fig. 1d). Compound 6 does not bind in the nucleotide pocket but extends from Cys 12 into an adjacent pocket composed largely of switch-II. This fully formed pocket is not apparent in other published structures of Ras, although a groove is visible in some cases13 (Extended Data Fig. 1b), and previous studies have suggested the presence of an allosteric site in this region14. We refer to the compound binding region as the switch-II pocket (S-IIP).
The S-IIP is located between the central β-sheet of Ras, and the α2-(switch-II) and α3-helices. Well-defined electron density shows the location of 6 deep within the S-IIP (432 Å2 interface; Extended Data Table 2) and confirms the disulphide linkage between 6 and Cys 12 (Fig. 1e; Fo − Fc at 2.5σ). The hydrophobic dichlorophenyl group of 6 makes several hydrophobic contacts (Fig. 1f). Glu 99 and Gly 60 form direct hydrogen bonds to 6. Whereas switch-II shows significant reordering to form the S-IIP, the conformation of switch-I is unchanged from the GDP-bound state. Structural analysis also suggested the presence of sub-pockets in S-IIP that might enable design of more potent inhibitors (Extended Data Fig. 2a, (o-) and (p-)).
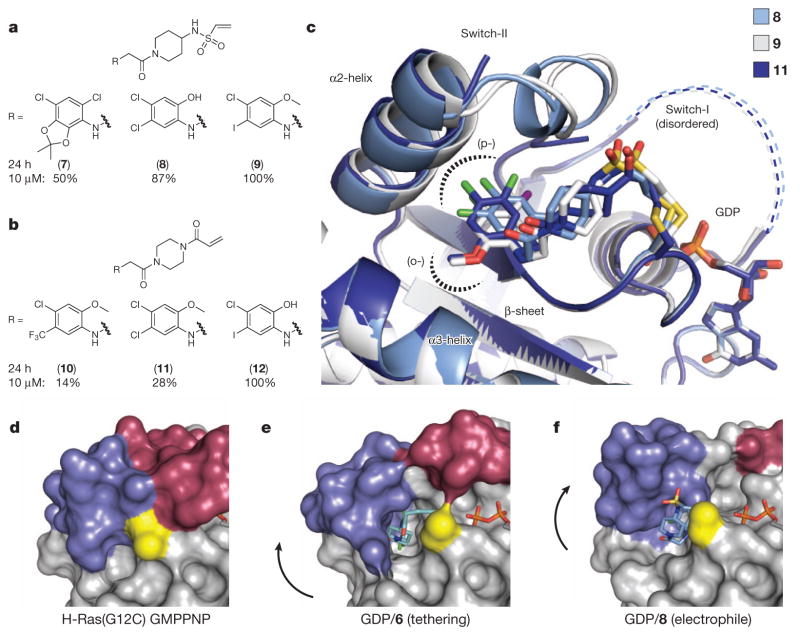
Rather than continue with disulphide-based compounds we turned to carbon-based electrophiles, acrylamides and vinyl sulphonamides, which are still chemoselective yet provide irreversible cysteine bond formation. We synthesized nearly 100 analogues guided by iterative structural evaluation to yield substantial improvements in potency (Fig. 2a–c and Supplementary Table 1). Owing to the irreversible nature of binding, potency was assessed by time-dependent modification of the protein, initially 200 μM compound for 24 h. A shift to 10 μM compound was necessary to differentiate optimized analogues (Extended Data Table 3 and Extended Data Fig. 3a), reaching the detection limit of the assay (4 μM K-Ras). Although vinyl sulphonamides generally performed better by these metrics, probably owing to higher reactivity15, we obtained highly effective acrylamides as well (Fig. 2b).
Figure 2. Electrophilic compounds bind to S-IIP of K-Ras(G12C) and disrupt switch-I and switch-II.
a, Subset of vinyl sulphonamide analogues. b, Subset of acrylamide analogues. Percentages in a and b represent adduct formation after 24 h with 10 μM compound. c, Overlay of co-crystal structures of 8, 9 and 11 with GDP-bound K-Ras(G12C). d–f, Binding of tethering compound 6 or electrophilic compound 8 to Cys 12 (yellow) of K-Ras GDP leads to displacement (arrows) of switch-II (blue) as compared to active Ras (H-Ras(G12C) GMPPNP; d). In the case of tethering compound 6 (e), switch-I (red) resembles the inactive GDP-bound conformation, however electrophile 8 (f) causes partial disordering of switch-I.
To evaluate the off-_target specificity of our most potent acrylamide 12, we used intact protein mass spectrometry to monitor simultaneously for modification of K-Ras(G12C) and bovine serum albumin (BSA) (one free cysteine) in a single mixture. Treatment with 12 resulted in the modification of K-Ras(G12C) but not BSA (Extended Data Fig. 3b), although both react with Ellman’s reagent (also known as DTNB) (Extended Data Fig. 3c). Optimized electrophiles show no detectable modification of wild-type K-Ras (Extended Data Fig. 3d). Fragments lacking the electrophile did not impair binding of compound 12 to K-Ras(G12C) (data not shown), suggesting limited binding to S-IIP in K-Ras proteins lacking the G12C mutation.
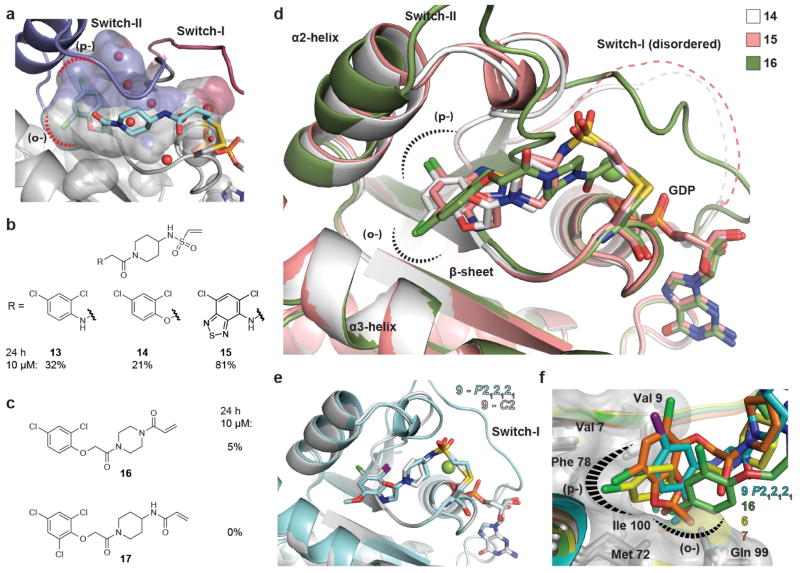
Overlaying multiple co-crystal structures revealed that the compounds follow a similar trajectory through the pocket and project functional groups into the (o-) and (p-) sub-pockets (Fig. 2c and Extended Data Fig. 2). Despite considerable variation at the terminal phenyl ring, the compounds satisfy similar hydrophobic interactions, supporting the crucial role of this region of the S-IIP (Fig. 2c and Extended Data Fig. 2).
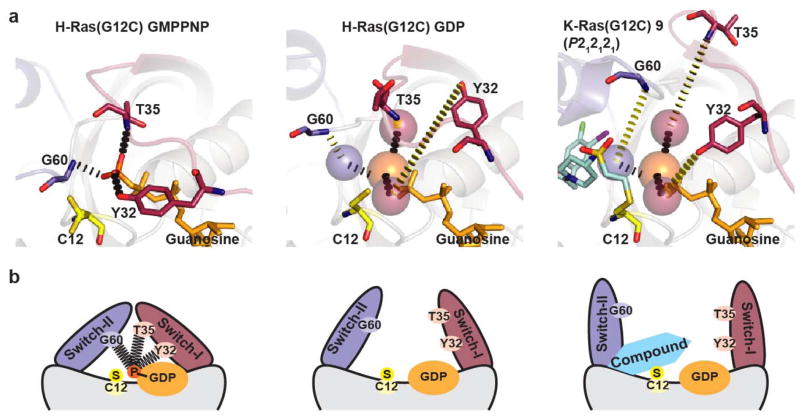
In the active state of Ras, residues from switch-II entirely fill the S-IIP (Fig. 2d). Co-crystal structures with tethering compound 6 and the electrophile 8 exhibit displacement of switch-II relative to the active conformation (Fig. 2e, f). Comparison of these co-crystal structures revealed distinct effects on switch-I and switch-II. Tethering compound 6 induces a small displacement of switch-II with little effect on switch-I. By contrast, electrophile 8 induces a more pronounced displacement of switch-II that results in disordering of switch-I and a lack of density for the metal ion.
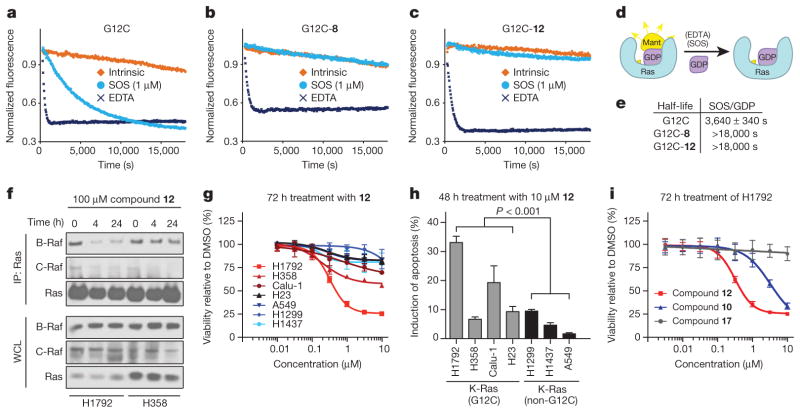
Proper metal coordination is crucial for tight nucleotide binding16, with mutation of magnesium-coordinating residues Ser 17 or Asp 57 leading to a preference for GDP over GTP17,18. Many of our structures with carbon-based electrophiles show disordering of switch-I and a lack of density for the metal ion (Extended Data Table 4). On the basis of these observations, we predicted that S-IIP binding compounds might differentially affect nucleotide affinities leading to a preference for GDP over GTP. To test this prediction, we carried out EDTA-catalysed off-exchange reactions with 2′-deoxy-3′-O-(N-methylanthraniloyl) (mant)-dGDP, while titrating unlabelled GDP or GTP (Fig. 3). In the absence of inhibitor, K-Ras(G12C) shows a slight preference for GTP (relative affinity 0.6 ± 0.2), as reported previously for H-Ras7. However, in the presence of either 8 or 12, GTP affinity is significantly decreased relative to GDP (relative affinity 3.9 ± 0.6 (8) and 3.5 ± 0.8 (12), P = 0.004, t-test) (Fig. 3b, c). The catalysis of nucleotide exchange by EDTA suggests that although our compounds may subtly affect metal binding leading to changes in nucleotide affinity, Mg2+ is not precluded even when the S-IIP is occupied.
Figure 3. Compound binding to S-IIP changes nucleotide preference of K-Ras from GTP to GDP.
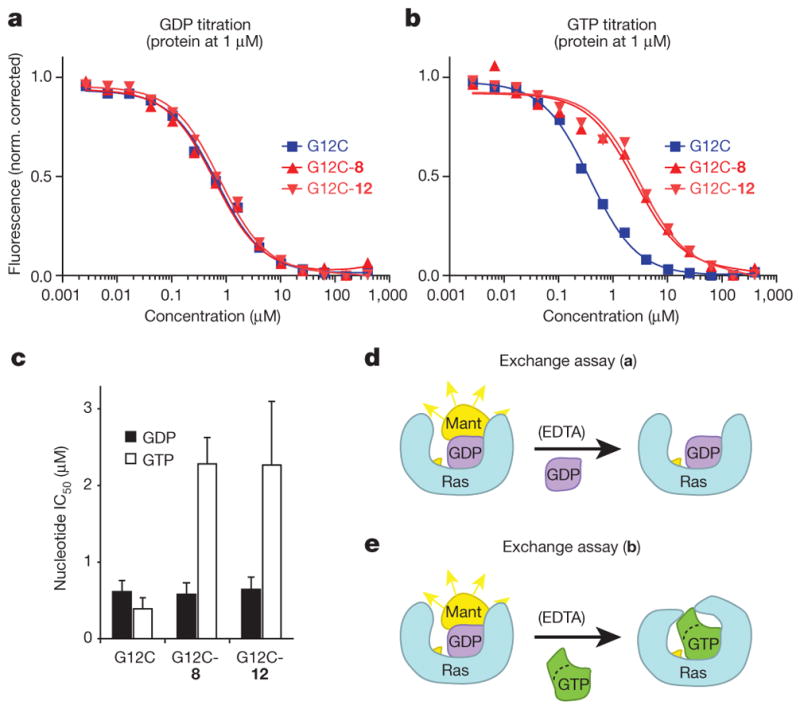
a, EDTA-mediated competition between mant-dGDP loaded on K-Ras(G12C) and free unlabelled GDP. The experiment was carried out with full-length K-Ras(G12C) alone (squares), or modified by 8 (upwards triangles) or 12 (downwards triangles) (n = 3). Data from a representative experiment is shown fitted to a sigmoidal curve for each protein. b, EDTA-mediated competition between bound mant-dGDP and free unlabelled GTP. c, Quantification of the GDP and GTP titrations in a and b (n = 3; error bars denote s.d.; IC50 obtained from sigmoidal fits).
d, e, Schematic representation of experiments shown in a (d) and b (e).
Structural analysis also predicts that the function of the exchange factor SOS would be compromised by compound binding to S-IIP19. Indeed, treatment of K-Ras(G12C) with either 8 or 12 blocks SOS-catalysed nucleotide exchange (Fig. 4a–e). As shown above, these compounds do not impair EDTA-catalysed GDP exchange.
Figure 4. Compounds block K-Ras(G12C) interactions, decrease viability and increase apoptosis of G12C-containing lung cancer cell lines.
a–c, SOS-catalysed nucleotide exchange for full-length K-Ras(G12C) alone (a), or K-Ras(G12C) labelled with 8 (b) or 12 (c). d, Schematic representation of a–c. e, Half-life of exchange for a–c (n = 3 biological replicates, error bars denote s.d.). f, Co-immunoprecipitation (IP) of B-Raf and C-Raf with Ras from K-Ras(G12C) cell lines after treatment with compound 12 (n = 3 biological replicates). WCL, whole cell lysate. g, Viability of K-Ras(G12C)-mutant cell lines (H1792, H358, Calu-1 and H23) and cell lines lacking this mutation (A549, H1299 and H1437) after treatment with 12 (n = 3 biological replicates, error bars denote s.e.m.). h, Induction of apoptosis after 48 h with 10 μM 12. i, H1792 cell viability assays carried out as in g, with range of concentrations of 10, 12 and 17 (n = 3 biological replicates, error bars denote s.e.m.).
In the active conformation of Ras, Gly 60 and Thr 35 make crucial contacts with the γ-phosphate20. Conservative mutations of Thr 35 (T35S) or Gly 60 (G60A) markedly impair effector binding21,22. Our compounds occupy the required position for Gly 60 in the active conformation and displace this residue to varying degrees, with larger distances correlating with disordering of switch-I (Extended Data Table 4 and Extended Data Fig. 4). This analysis led to the prediction that our compounds would disrupt the conformation of the GTP state of Ras and impair interactions with effectors such as Raf. We measured Ras–Raf association in two K-Ras(G12C)-mutant lung cancer cell lines, H1792 and H358, using co-immunoprecipitation. As predicted, treatment with 12 decreased the association of B-Raf and C-Raf with Ras (Fig. 4f). Although this effect is evident in both cell lines, it is most pronounced in H1792 cells, which express lower levels of Ras23.
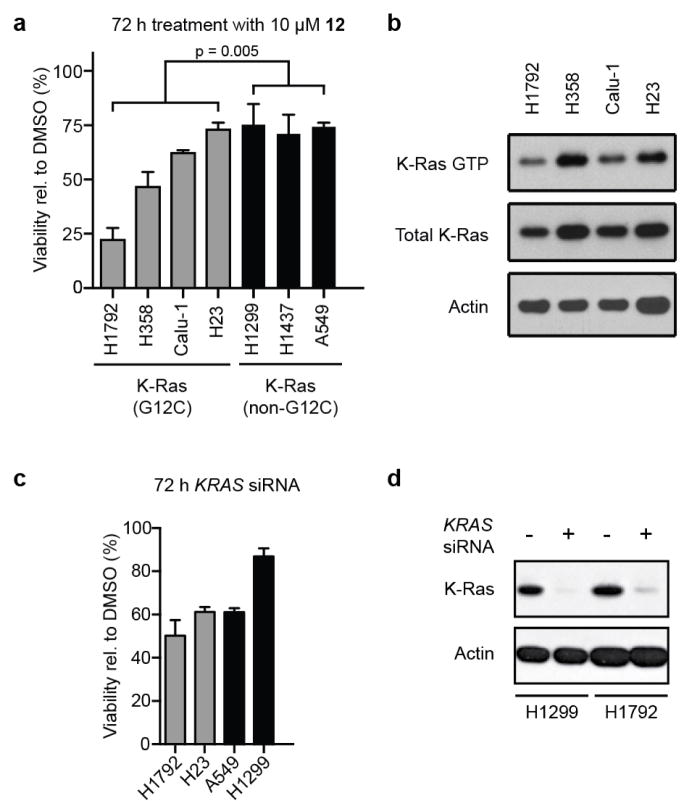
Despite limited compound potency, we speculated that the genotype-specificity might afford a therapeutic window for the _targeted inhibition of K-Ras(G12C) in cellular models. Therefore, we compared the effects of 12 in a small collection of genetically annotated lung cancer cell lines. As expected, the group of cell lines containing G12C mutations (H1792, H358, H23 and Calu-1) showed decreased viability (Fig. 4g and Extended Data Fig. 5; P = 0.005, t-test) and increased apoptosis (Fig. 4h; P <0.001, t-test) relative to the group lacking this mutation (H1437, H1299 and A549) after treatment with 12. The highly sensitive H1792 cells show low levels of K-Ras GTP (Extended Data Fig. 5b), consistent with preferential binding of our inhibitors to K-Ras GDP (Fig. 1b), and they are highly K-Ras dependent24 (Extended Data Fig. 5c). Notably, both K-Ras-dependent (A549) and -independent (H1299) cell lines lacking G12C were insensitive to compound 12 (Fig. 4g, h and Extended Data Fig. 5). The half-maximum effective concentration (EC50) for compound 12 in H1792 cells (0.32 ± 0.01 μM) is tenfold lower than that of compound 10 (3.2 ± 0.4 μM), consistent with in vitro K-Ras labelling efficiency (Fig. 2b, 100% versus 14% labelling at 24 h). Notably, the highly related electrophile-containing compound 17, which does not modify K-Ras(G12C) in vitro (Extended Data Fig. 2c, 0% at 24 h), shows no effect on H1792 cell viability. Overall, our cellular data provide a proof-of-concept for the genotype-specific use of S-IIP binding compounds in K-Ras(G12C)-driven cancer.
Using a structure-guided approach to _target the G12C mutant of K-Ras, we have identified a new allosteric pocket, S-IIP, in this protein, and we have used that pocket to develop irreversible, mutant-specific inhibitors of Ras function. The S-IIP is not visible in other structures of Ras, and thus it is probably highly dynamic when GDP is bound, until initial encounter with our compounds. Compound binding to S-IIP impairs Ras function through two distinct mechanisms. First, by shifting the relative nucleotide affinities of Ras to favour GDP over GTP, the compounds should lead to accumulation of Ras in the inactive state. Notably, the two most effective cellular GTPase inhibitors, the natural products brefeldin A and YM-254890, both bind to and stabilize a GDP-bound state of their respective GTPases25,26. So far, published small molecules that bind Ras have not shown this nucleotide preference14,27–29. Second, compounds occupying S-IIP diminish interactions with effectors and regulatory proteins. This should act to diminish signalling by K-Ras further. Despite the need for continued chemical optimization of our compounds for future assessment in vivo, initial evaluation of our compounds in lung cancer cell lines suggests allele-specific impairment of K-Ras function. On the basis of these data and our understanding of the biochemical mechanism of the inhibitors, we are confident that our findings can serve as the starting point for drug-discovery efforts _targeting K-Ras(G12C) and eventually other alleles of K-Ras.
METHODS
Protein expression and purification
Hexahistidine-tagged recombinant human K-Ras (isoform 2, residues 1–169, based on construct used for PDB accession 3GFT) was transformed into Escherichia coli (BL21 (DE3)). After the bacterial growth to an attenuance (D) at 600 nm of 0.4–0.6 in Terrific Broth containing 30 mg l−1 kanamycin at 37 °C, induction was carried out at 18 °C using 0.5 mM isopropyl-β-D-thiogalactoside (IPTG), and growth was continued at 18 °C for about 18 h. The bacteria were collected by centrifugation, and the obtained pellet either stored at −80 °C or used freshly for the subsequent steps.
The pellet was resuspended in lysis buffer (500 mM NaCl, 20 mM Tris, pH 8.0 and 5 mM imidazole) containing protease inhibitor cocktail (Roche complete EDTA free), the bacteria were lysed by microfluidizer, 2 mM β-mercaptoethanol (βME) (final) was added and cell debris was removed by ultracentrifugation. The supernatant was incubated for 1 h with Co-affinity beads (Clontech, ~2 ml bed volume per 1 l initial culture), the loaded beads were then washed with lysis buffer containing 2 mM βME and the protein was eluted with buffer containing 125–250 mM imidazole. The hexahistidine tag was then cleaved using hexahistidine-tagged TEV-protease (1 mg recombinant TEV per 25 mg crude K-Ras, 1 mg GDP added per 20 mg crude K-Ras) while dialysing against a buffer containing 300 mM NaCl, 20 mM Tris, pH 8.0, 5 mM imidazole, 1 mM dithiothreitol (DTT) and 0.5 mM EDTA. The cleaved protein was then diluted fivefold with low-salt buffer (50 mM NaCl, 20 mM Tris, pH 8.0), incubated with Ni-agarose beads (Qiagen) to remove uncleaved protein and protease, and 5 mM MgCl2 and GDP was added to load the metal and nucleotide site of K-Ras fully.
The crude protein was then purified by ion-exchange chromatography (HiTrap Q HP column, salt gradient from 50 to 500 mM NaCl) to give the partially purified protein, commonly in the following buffer (~230 mM NaCl, 20 mM Tris, pH 8.0, small amounts of GDP). At this point the protein was either fully labelled with the desired compound (incubation overnight with an excess of compound at 4 °C, labelling checked by mass spectrometry analysis), frozen down and stored at −80 °C, or used for further purification.
The last purification step for the labelled or unlabelled protein was gel filtration using either a Superdex 75 or 200 column (10/300 GL) with the following buffer: 20 mM HEPES, pH 7.5, 150 mM NaCl and 1 mM DTT (for the unlabelled proteins). The freshly prepared and purified protein was then concentrated to 5–20 mg ml−1 and used for the X-ray crystallography trays.
Sequences for the different K-Ras constructs were generally codon-optimized and synthesized by DNA2.0 using the pJexpress411 vector. For the X-ray structures of compound-labelled K-Ras(G12C), a cysteine-light mutant was used (K-Ras (G12C/C51S/C80L/C118S)) to enable more uniformly labelled species.
Purification and labelling of full-length forms of the protein as well as H-Ras was carried out analogously. Nucleotide exchange for crystallographic samples was carried out following published procedures4,27,30.
Tethering screen
Untagged recombinant K-Ras(G12C) (1–169) at 1 μM was reacted with 100 μM fragment and 100 μM βME in 20 mM HEPES, pH 7.5, 150 mM NaCl and 10 mM EDTA for 1 h at ambient temperature. The extent of modification was assessed by electrospray mass spectrometry using a Waters LCT-Premier LC/ESI-MS. By setting a threshold of ≥60% modification, we achieved a hit rate of 1.9%.
Determination of DR50 and relative potency of fragments
The DR50 is determined by titrating fragment while maintaining a constant βME concentration, in this case 200 μM βME. DR50 = [βME]/[fragment], at which 50% modification is achieved by total protein mass spectrometry10. Relative potency is reported as: fragment DR50/6H05 DR50.
Mass spectrometric screen for extent of irreversible labelling
Untagged recombinant K-Ras(G12C) (1–169) at 4 μM was reacted with inhibitors at 200 μM or 10 μM (2% (v/v) dimethylsulphoxide (DMSO) final) in 20 mM HEPES, pH 7.5, 150 mM NaCl and 1 mM EDTA. After 24 h, 10-μl aliquots were removed and the reactions were stopped by the addition of 1 μl 2% (v/v) formic acid. For the BSA specificity experiment, 16 μM BSA was included in the mixture and the reaction was analysed at 6 h, without acid treatment. A similar mixture of K-Ras(G12C) and BSA was treated instead with 200 μM Ellman’s reagent and labelling was analysed after 5 min. In all cases, the extent of modification was assessed by electrospray mass spectrometry using a Waters Acquity UPLC/ESI-TQD with a 2.1 × 50 mm Acquity UPLC BEH300 C4 column.
Plate-based assay to determine relative affinity of K-Ras for GDP or GTP
The corresponding recombinantly expressed, full-length K-Ras protein (G12C mutant or G12C mutant labelled fully with either compound 8 or 12) at about 10 μM concentration was incubated with 200 μM mant-dGDP (Jena Biosciences) in the presence of 2.5 M EDTA. After 1 h at room temperature, MgCl2 to a final concentration of 10 mM was added. The protein was then run through a NAP-5 column to remove free nucleotide. The concentration of the obtained protein was determined by Bradford assay and the protein was then used in the described plate-based assay.
For the assay, 10 μl of the prepared protein in reaction buffer (20 mM HEPES, pH 7.5, 150 mM NaCl, 1 mM DTT and 1 mM MgCl2) was added to a well of a low volume black bottom plate (Corning, 3676). The fluorescence intensity was measured on a spectramax M5 plate reader (Molecular Devices, 360 nm excitation, 440 nm emission) to provide a value used in later normalization. Then, 5 μl of an EDTA solution with the indicated nucleotide (GDP or GTP) was added to each well and the reaction mix was allowed to equilibrate for 2 h at room temperature. Measurement of the fluorescent intensity at this time provided the end point. Samples were measured in duplicates for each experiment. In the final mix the concentrations were the following: protein (1 μM), EDTA (5 mM) and nucleotide (as indicated, titrated in 2.5-fold dilution series, 15 points). Curves show results from one representative experiment, the column graph shows the averaged data from three experiments, with errors representing s.d. For the determination of IC50, a sigmoidal curve fit was used for each nucleotide (Prism software).
Nucleotide exchange rates for compound-bound K-Ras(G12C)
The experiment was carried out similarly as described for the nucleotide affinity assay using the same plate set-up and plate reader. In brief, the respective full-length proteins were loaded with mant-dGDP (see above). For the assay, 10 μl of the prepared protein (1 μM final) in reaction buffer was added to the wells. To start the reaction, 5 μl of SOS (1 μM final), EDTA (5 mM final), or buffer was added and the fluorescence monitored for 5 h at 90-s intervals. Half-lives were determined using Prism software (single-exponential decay fit).
Cell culture
H23, H358, H1299, H1437, H1792, Calu-1 and A549 (ATCC) were cultured in DMEM with 10% FBS.
Viability assays
Cells were plated in 96-well plates at 2,000 cells per well in 90 μl DMEM with 10% FBS and allowed to attach for 24 h. Cells were treated by the addition of 10 μl 100 μM compound (or half-log dilutions thereof) or vehicle (0.1% DMSO final). After 72 h, media was exchanged and plates were analysed using CellTiter-Glo Luminescent Cell Viability Assay (Promega).
Apoptosis assays
The Annexin V-FITC Apoptosis Detection Kit I (BD Biosciences) was used to detect apoptotic cells. Cell lines were plated in 6-well plates at ~50% confluence, and after 24 h cells were treated with the given compound for 48 h. Subsequently, cells were washed with PBS, trypsinized and resuspended in 150 μl annexin-V binding buffer. Finally, cells were stained with annexin-V-FITC and propidium iodide and incubated in the dark before analysis on a FACS LSRII Flow Cytometer (Beckman Coulter). Data were collected using FACSDiva analysis software (Beckman Coulter). At least 10,000 cells were measured per individual sample. Results are given as Δannexin-V/propidium-iodide unstained cells of untreated (DMSO) versus treated samples.
siRNA knockdown
Cells were plated either in 96-well plates or 6-well plates 24 h before transfection with short interfering RNA (siRNA). The siRNA constructs were diluted (10–20 nM) in RNAiMax-Lipofectamine (Life Technologies) containing OPTI-MEM media, and after 20 min of incubation the mixture was added drop-wise to the cells. After 72 h of incubation, cells were either lysed for immunoblotting experiments (K-Ras antibody, Sigma 3B10-2F2; actin antibody, Cell Signaling Technology 4970) or subjected to CellTiterGlo assays (Promega) for proliferation analysis. The KRAS siRNA guide and passenger strand sequences used were as follows: guide, 5′-ACUGUACUCCUCUUGACCUGCU-3′; passenger, 5′-CAGGUCAAGAGGAGUACAGUUA-3′.
Immunoprecipitation
Cells were treated at given conditions in 10-cm plates and lysed in phosphatase and protease inhibitor containing lysis buffer. Lysates were mixed with 4 μl primary Ras antibody (Abcam, EPR3255), and incubated with rocking overnight at 4 °C. Protein G agarose beads were added to the mixture, and after 3 h beads were pelleted, washed with lysis buffer, and after resuspension in loading buffer and heating at 95 °C for 5 min were analysed by SDS–PAGE followed by immunoblot. B-Raf (Santa Cruz, F-7) and C-Raf (Cell Signaling Technology, 9422) antibodies were used to detect the individual proteins.
Extended Data
Extended Data Figure 1. Comparison of co-crystal structure of 6 with K-Ras(G12C) to known structures of Ras.

a, Compound 6 (cyan) bound in the S-IIP of K-Ras(G12C). b, Compound 6 (aligned and overlayed) with GDP-bound wild-type H-Ras showing groove near S-IIP (PDB accession 4Q21)13. c, Clash of compound 6 (aligned and overlayed) with GTPγS-bound K-Ras(G12D), which shows glycerol molecule adjacent to S-IIP (PDB accession 4DSO)27.
Extended Data Figure 2. Additional insights into Ras-compound binding and its biochemical effects.
a, Compound 6 (cyan) is attached to Cys 12 of K-Ras(G12C) and extends into an allosteric binding pocket beneath switch-II (blue), the S-IIP. The binding pocket in K-Ras (surface representation of the protein shown) fits 6 tightly and includes hydrophobic sub-pockets (dashed lines). An extension of the pocket is occupied by water molecules (red spheres) and might provide space for modified compound analogues. b–d, X-ray crystallographic studies of K-Ras(G12C) bound to several additional electrophilic analogues (14, 15 and 16, respectively) reveal a similar overall binding mode. All compounds follow a similar trajectory from Cys 12 into S-IIP but show some variability in the region of the piperidine/piperazine. The respective switch-I regions of the protein can be disordered. e, Overlay of the two different crystal forms of K-Ras(G12C) bound to 9 (space group C2 (grey) and P212121 (cyan)) is shown. The ligand orientation and conformation shows minimal changes, whereas switch-II of the protein appears disordered in the C2 form and atypical in the P212121 form. f, An overlay for several compounds including the disulphide 6 is shown (16-green, 6-yellow, 7-orange, 9-cyan). Key hydrophobic residues are labelled and hydrophobic interaction between the compounds and the (p-) or (o-) sub-pockets are indicated by dashed lines.
Extended Data Figure 3. Analysis of compound labelling rate and in vitro specificity.

a, Percentage modification of K-Ras(G12C) by compounds 9 and 12 over time (n = 3, error bars denote s. d.). b, Selective single labelling of K-Ras(G12C) by compound 12 in the presence of BSA. c, Quantitative single labelling of BSA and multiple labelling of K-Ras(G12C) by DTNB. d, Comparison of modification of K-Ras(G12C) and wild-type by 12 (n = 3, error bars denote s.d.).
Extended Data Figure 4. Comparison of active conformation and compound bound form of Ras.
a, X-ray crystal structure of the active conformation of H-Ras(G12C) with GMPPNP shows interactions of the γ-phosphate with key residues (Tyr 32, Thr 35 and Gly 60) that hold switch-I (red) and switch-II (blue) in place. The inactive GDP-bound structure of H-Ras(G12C) reveals the absence of these key interactions and increased distances between these residues and the position of the γ-phosphate (positions from GMPPNP structure indicated by spheres) coinciding with large conformational changes in both switch regions. In the P212121 crystal form of 9 bound to K-Ras(G12C) GDP switch-I is ordered (often disordered by compounds, see Extended Data Table 4), but the structure shows displacement of the γ-phosphate-binding residues beyond their positions in the inactive state. b, As indicated by the X-ray structures, removal of the γ-phosphate leads to relaxation of the ‘spring-loaded’ Ras-GTP back to the GDP state, with opening of switch-II. Compound binding moves switch-II even further away and interferes with GTP binding itself.
Extended Data Figure 5. Inhibitor sensitivity, K-Ras GTP levels and K-Ras dependency of lung cancer cell lines.
a, Percentage viability after treatment for 72 h with 12 relative to DMSO (n = 3 biological replicates, error bars denote s.e.m.). b, K-Ras GTP levels determined by incubating lysates with glutathione S-transferase (GST)-tagged RBD (Ras-binding domain of C-Raf) immobilized on glutathione beads (n = 3 biological replicates). c, Viability of cell lines evaluated 72 h after transfection with KRAS siRNA (n = 3 biological replicates). d, K-Ras immunoblot showing knockdown after KRAS siRNA (n = 3 biological replicates).
Extended Data Table 1.
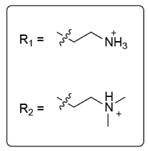
Hit fragments and percentage modification from the primary tethering screen
| Fragment structure | Fragment number | Percent Modification | |
|---|---|---|---|

|
2C10 | 60% | |

|
2D04 | 60% | |

|
2D05 | 60% | |
|
|
2E07 | 70% | |
|
|
3C09 | 60% | |

|
4C09 | 60% | |

|
5B03 | 60% | |
|
|
5F10 | 65% |
|

|
6H05 | 95% |
Extended Data Table 2.
Overview of obtained and previously published co-crystal structures and their respective compound–protein binding interfaces
| Compound | PDB-code | Space group Unit cell |
Compound-protein interface (Å2) | Solvent Accessible Surface Area/ Buried Surface Area in structure (Å2) |
|---|---|---|---|---|
 4 |
4LV6 | P1 (33,39,63Å) (77,81,77°) | 421 | 601/531 (chain A) |
 6 |
4LUC | P1 (33,39,62Å) (78,82,78°) | 432 | 629/548 (chain A) |
 7 |
4M1O | C2 (68,84,86Å) (90,111,90°) | 407 | 625/489 (chain B) |
 8 |
4LYF | C2 (68,84,87Å) (90,111,90°) | 359 | 565/430 (chain B) |
 9 |
4LYH | C2 (68,84,87Å) (90,111,90°) | 408 | 620/507 (chain B) |
 9 |
4LYJ | P212121 (39,43,88Å) (90,90,90°) | 412 | 632/517 (chain A) |
 11 |
4M21 | C2 (68,84,87Å) (90,111,90°) | 297 | 574/372 (chain B) |
 13 |
4M1S | C2 (68,84,86Å) (90,111,90°) | 346 | 580/442 (chain B) |
 14 |
4M1T | C2 (68,83,85Å) (90,111,90°) | 355 | 579/444 (chain B) |
 15 |
4M1Y | C2 (68,84,87Å) (90,111,902) | 387 | 599/480 (chain B) |
 16 |
4M22 | C2 (71,83,87Å) (90,109,90°) | 324 | 535/399 (chain B) |
 DCAI K-Ras(G12D) Ref. 27 |
4DST | H3 (79,79,78.6Å) (90,90,120°) | 204 | 403/252 |
 “13” K-Ras(G12V), Ref. 28 |
4EPY | P212121 (39,41,92Å) (90,90,90°) | 301 | 606/370 |
Extended Data Table 3.
Extent of labelling after 24h at 10 μM inhibitor
| Vinyl sulphonamide inhibitors | Modification (%) | Acrylamide inhibitors | Modification (%) |
|---|---|---|---|
| 7 | 50 | 10 | 14 |
| 8 | 87 | 11 | 28 |
| 9 | 100 | 12 | 100 |
| 13 | 21 | 16 | 5 |
| 14 | 32 | 17 | 0 |
| 15 | 81 |
Extended Data Table 4.
Increased distance (Å) between position-12 Cα and Gly 60 Cα correlates with disordering of switch-I
| GDP-bound | 12 Cα to 60 Cα distance (Å) | Switch-I | Metal ion |
|---|---|---|---|
| WT | 8 | Mg | |
| H-Ras(S17N)* | 8.1 | disordered | Ca |
| 16 | 8.3 | Mg | |
| 4 | 9 | Ca | |
| 6 | 9.1 | Ca | |
| 13 | 11.1 | disordered | - |
| 9 (P212121)† | 11.2 | atypical | Mg |
| 14 | 11.6 | disordered | - |
| 8 | 11.9 | disordered | - |
| 15 | 12 | disordered | - |
| 9 (C2)† | 12.7 | disordered | - |
| 7 | 12.8 | disordered | - |
| 11 | switch-II disordered | disordered | - |
| GTP-bound | 12 Cα to 60 Cα distance (Å) | Switch-I | Metal ion |
|---|---|---|---|
| H-Ras(G12C) | 3.8 | Mg | |
| K-Ras(WT)‡ | 3.9 | Mg | |
| RaplA with CRAF RBD§ | 3.9 | Mg |
PDB accession 3LO5.
Compound 9 co-crystalized in two different space groups, P212121 and C2.
PDB accession 3GFT.
PDB accession 1C1Y.
Acknowledgments
We are grateful to M. Burlingame and J. Sadowsky for assistance with the tethering screen; P. Ren and Y. Liu for assistance in chemical design and discussions; N. Younger for preparing several compounds; J. Kuriyan for sharing SOS and H-Ras constructs; F. McCormick and T. Yuan for discussion and sharing K-Ras reagents; R. Goody, K. Shannon and F. Wittinghofer for discussion. U.P. was supported by a postdoctoral fellowship of the Tobacco-related Disease Research Program (19FT-0069). The Advanced Light Source is supported by the Director, Office of Science, Office of Basic Energy Sciences, of the US Department of Energy under Contract No. DE-AC02-05CH11231. M.L.S. is a fellow of the International Association for the Study of Lung Cancer (IASLC) and receives a Young Investigator Award of the Prostate Cancer Foundation (PCF).
Footnotes
Supplementary Information is available in the online version of the paper.
Author Contributions J.M.O., U.P., J.A.W. and K.M.S. designed the study. J.M.O., U.P. and K.M.S. designed the molecules and wrote the manuscript. J.M.O. and U.P. performed the initial screen, synthesized the molecules and performed biochemical assays. U.P. expressed and purified the proteins and performed structural studies. J.M.O. and M.L.S. performed the cellular assays. J.M.O., U.P., M.L.S. and K.M.S performed analysis. All authors edited and approved the manuscript.
Atomic coordinates and structure factors for the reported crystal structures have been deposited with the Protein Data Bank (PDB), and accession numbers can be found in Extended Data Table 2.
The authors declare competing financial interests: details are available in the online version of the paper.
Readers are welcome to comment on the online version of the paper.
References
- 1.Slebos RJC, et al. K-ras oncogene activation as a prognostic marker in adenocarcinoma of the lung. N Engl J Med. 1990;323:561–565. doi: 10.1056/NEJM199008303230902. [DOI] [PubMed] [Google Scholar]
- 2.Pao W, et al. KRAS mutations and primary resistance of lung adenocarcinomas to gefitinib or erlotinib. PLoS Med. 2005;2:e17. doi: 10.1371/journal.pmed.0020017. [DOI] [PMC free article] [PubMed] [Google Scholar]
- 3.Lièvre A, et al. KRAS mutation status is predictive of response to cetuximab therapy in colorectal cancer. Cancer Res. 2006;66:3992–3995. doi: 10.1158/0008-5472.CAN-06-0191. [DOI] [PubMed] [Google Scholar]
- 4.John J, et al. Kinetics of interaction of nucleotides with nucleotide-free H-ras p21. Biochemistry. 1990;29:6058–6065. doi: 10.1021/bi00477a025. [DOI] [PubMed] [Google Scholar]
- 5.Gibbs JB, Sigal IS, Poe M, Scolnick EM. Intrinsic GTPase activity distinguishes normal and oncogenic ras p21 molecules. Proc Natl Acad Sci USA. 1984;81:5704–5708. doi: 10.1073/pnas.81.18.5704. [DOI] [PMC free article] [PubMed] [Google Scholar]
- 6.Trahey M, McCormick F. A cytoplasmic protein stimulates normal N-ras p21 GTPase, but does not affect oncogenic mutants. Science. 1987;238:542–545. doi: 10.1126/science.2821624. [DOI] [PubMed] [Google Scholar]
- 7.Scherer A, et al. Crystallization and preliminary X-ray analysis of the human c-H-ras-oncogene product p21 complexed with GTP analogues. J Mol Biol. 1989;206:257–259. doi: 10.1016/0022-2836(89)90540-8. [DOI] [PubMed] [Google Scholar]
- 8.Erlanson DA, et al. Site-directed ligand discovery. Proc Natl Acad Sci USA. 2000;97:9367–9372. doi: 10.1073/pnas.97.17.9367. [DOI] [PMC free article] [PubMed] [Google Scholar]
- 9.Burlingame MA, Tom CTMB, Renslo AR. Simple one-pot synthesis of disulfide fragments for use in disulfide-exchange screening. ACS Comb Sci. 2011;13:205–208. doi: 10.1021/co200038g. [DOI] [PubMed] [Google Scholar]
- 10.Sadowsky JD, et al. Turning a protein kinase on or off from a single allosteric site via disulfide trapping. Proc Natl Acad Sci USA. 2011;108:6056–6061. doi: 10.1073/pnas.1102376108. [DOI] [PMC free article] [PubMed] [Google Scholar]
- 11.Forbes SA, et al. The catalogue of somatic mutations in cancer (COSMIC) Curr Protoc Hum Genet. 2008;57:10.11.1–10.11.26. doi: 10.1002/0471142905.hg1011s57. [DOI] [PMC free article] [PubMed] [Google Scholar]
- 12.Bar-Sagi D. A Ras by any other name. Mol Cell Biol. 2001;21:1441–1443. doi: 10.1128/MCB.21.5.1441-1443.2001. [DOI] [PMC free article] [PubMed] [Google Scholar]
- 13.Milburn MV, et al. Molecular switch for signal transduction: structural differences between active and inactive forms of protooncogenic ras proteins. Science. 1990;247:939–945. doi: 10.1126/science.2406906. [DOI] [PubMed] [Google Scholar]
- 14.Taveras AG, et al. Ras oncoprotein inhibitors: the discovery of potent, ras nucleotide exchange inhibitors and the structural determination of a drug–protein complex. Bioorg Med Chem. 1997;5:125–133. doi: 10.1016/s0968-0896(96)00202-7. [DOI] [PubMed] [Google Scholar]
- 15.Naven RT, Kantesaria S, Nadanaciva S, Schroeter T, Leach KL. High throughput glutathione and Nrf2 assays to assess chemical and biological reactivity of cysteine-reactive compounds. Toxicol Rev. 2013;2:235–244. [Google Scholar]
- 16.John J, et al. Kinetic and structural analysis of the Mg2+-binding site of the guanine nucleotide-binding protein p21H-ras. J Biol Chem. 1993;268:923–929. [PubMed] [Google Scholar]
- 17.Feig LA, Cooper GM. Inhibition of NIH 3T3 cell proliferation by a mutant ras protein with preferential affinity for GDP. Mol Cell Biol. 1988;8:3235–3243. doi: 10.1128/mcb.8.8.3235. [DOI] [PMC free article] [PubMed] [Google Scholar]
- 18.Farnsworth CL, Feig LA. Dominant inhibitory mutations in the Mg2+-binding site of RasH prevent its activation by GTP. Mol Cell Biol. 1981;11:4822–4829. doi: 10.1128/mcb.11.10.4822. [DOI] [PMC free article] [PubMed] [Google Scholar]
- 19.Hall BE, Yang SS, Boriack-Sjodin PA, Kuriyan J, Bar-Sagi D. Structure-based mutagenesis reveals distinct functions for Ras switch 1 and switch 2 in Sos-catalyzed guanine nucleotide exchange. J Biol Chem. 2001;276:27629–27637. doi: 10.1074/jbc.M101727200. [DOI] [PubMed] [Google Scholar]
- 20.Pai EF, et al. Structure of the guanine-nucleotide-binding domain of the Ha-ras oncogene product p21 in the triphosphate conformation. Nature. 1989;341:209–214. doi: 10.1038/341209a0. [DOI] [PubMed] [Google Scholar]
- 21.Sung YJ, Carter M, Zhong JM, Hwang YW. Mutagenesis of the H-ras p21 at glycine-60 residue disrupts GTP-induced conformational change. Biochemistry. 1995;34:3470–3477. doi: 10.1021/bi00010a040. [DOI] [PubMed] [Google Scholar]
- 22.Hwang MCC, Sung YJ, Hwang YW. The differential effects of the Gly-60 to Ala mutation on the interaction of H-Ras p21 with different downstream _targets. J Biol Chem. 1996;271:8196–8202. doi: 10.1074/jbc.271.14.8196. [DOI] [PubMed] [Google Scholar]
- 23.Sunaga N, et al. Knockdown of oncogenic KRAS in non-small cell lung cancers suppresses tumor growth and sensitizes tumor cells to _targeted therapy. Mol Cancer Ther. 2011;10:336–346. doi: 10.1158/1535-7163.MCT-10-0750. [DOI] [PMC free article] [PubMed] [Google Scholar]
- 24.Barbie DA, et al. Systematic RNA interference reveals that oncogenic KRAS-driven cancers require TBK1. Nature. 2009;462:108–112. doi: 10.1038/nature08460. [DOI] [PMC free article] [PubMed] [Google Scholar]
- 25.Peyroche A, et al. Brefeldin A acts to stabilize an abortive ARF–GDP–Sec7 domain protein complex. Mol Cell. 1999;3:275–285. doi: 10.1016/s1097-2765(00)80455-4. [DOI] [PubMed] [Google Scholar]
- 26.Nishimura A, et al. Structural basis for the specific inhibition of heterotrimeric Gq protein by a small molecule. Proc Natl Acad Sci USA. 2010;107:13666–13671. doi: 10.1073/pnas.1003553107. [DOI] [PMC free article] [PubMed] [Google Scholar]
- 27.Maurer T, et al. Small-molecule ligands bind to a distinct pocket in Ras and inhibit SOS-mediated nucleotide exchange activity. Proc Natl Acad Sci USA. 2012;109:5299–5304. doi: 10.1073/pnas.1116510109. [DOI] [PMC free article] [PubMed] [Google Scholar]
- 28.Sun Q, et al. Discovery of small molecules that bind to K-Ras and inhibit Sos-mediated activation. Angew Chem. 2012;124:6244–6247. doi: 10.1002/anie.201201358. [DOI] [PMC free article] [PubMed] [Google Scholar]
- 29.Shima F, et al. In silico discovery of small-molecule Ras inhibitors that display antitumor activity by blocking the Ras-effector interaction. Proc Natl Acad Sci USA. 2013;110:8182–8187. doi: 10.1073/pnas.1217730110. [DOI] [PMC free article] [PubMed] [Google Scholar]
- 30.Ahmadian MR, et al. Guanosine triphosphatase stimulation of oncogenic Ras mutants. Proc Natl Acad Sci USA. 1999;96:7065–7070. doi: 10.1073/pnas.96.12.7065. [DOI] [PMC free article] [PubMed] [Google Scholar]


