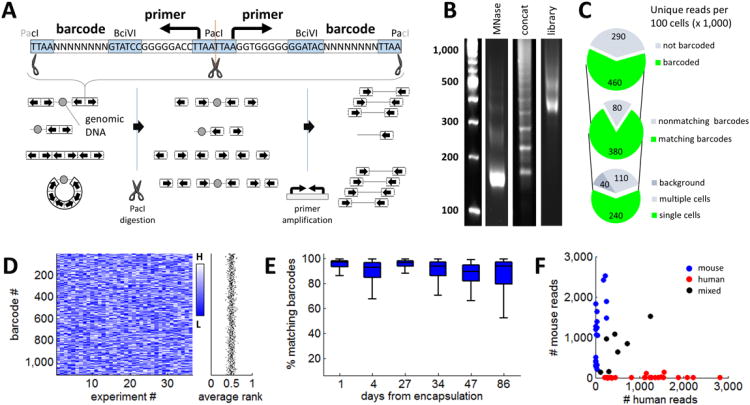
Figure 3. Symmetric barcoding and amplification of chromatin fragments.

A) Barcode adapters (top) are 64 bp double-stranded oligonucleotides with universal primers, barcode sequences and restriction sites, whose symmetric design allows ligation on either side. Schematic (bottom left) depicts possible outcomes of ligation in drops, including symmetrically labeled nucleosomes, asymmetrically labeled nucleosomes, and adapter concatemers. Concatemers are removed by digestion of PacI sites formed by adapter juxtaposition (bottom center), allowing selective PCR amplification of symmetrically adapted chromatin fragments (bottom right). See also Supplementary Figure 2. B) Gel electrophoresis for DNA products at successive assay stages: left: DNA ladder; MNase: DNA fragments purified after capture, lysis and MNase digestion of single cells in drops confirm efficient digestion to mononucleosomes (∼1 million drops collected); Concat: Illumina library prepared from adaptor-ligated chromatin fragments without PacI digestion reveals overwhelming concatemer bias. Library: Illumina library prepared from adaptor-ligated chromatin fragments digested with PacI, reveals appropriate MNase digestion pattern, shifted by the size of barcode and Illumina adapters. C) Pie charts depict numbers of uniquely aligned sequencing read that satisfy successive filtering criteria (values reflect data from 100 single cells, averaged over 82 trials). We select reads that have barcode sequences on both ends (top) with matching sequence (middle). We then apply a Poisson model to identify barcodes that represent single cells (bottom). D) Heatmap depicts homogeneity of barcode selection. Barcodes (rows) are colored according to their relative prevalence (rank order) across 37 experiments (columns). The absence of bias towards particular barcodes (light or dark horizontal stripes) indicates the homogeneity of the barcode library. The mean normalized rank over all barcodes (right) is close to 0.5, consistent with balanced representation. E) Stability of the barcode library emulsion over time. The fraction of reads with matching barcodes on both ends is plotted as a function of time from encapsulation of the barcode library. F) The microfluidics system was applied to barcode a mixed suspension of human and mouse cells. For each barcode, plot depicts the number of reads aligning to the mouse genome (y-axis) versus the number of reads aligning to the human genome (x-axis). The data suggest that a vast majority of barcodes is unique to a single cell.
