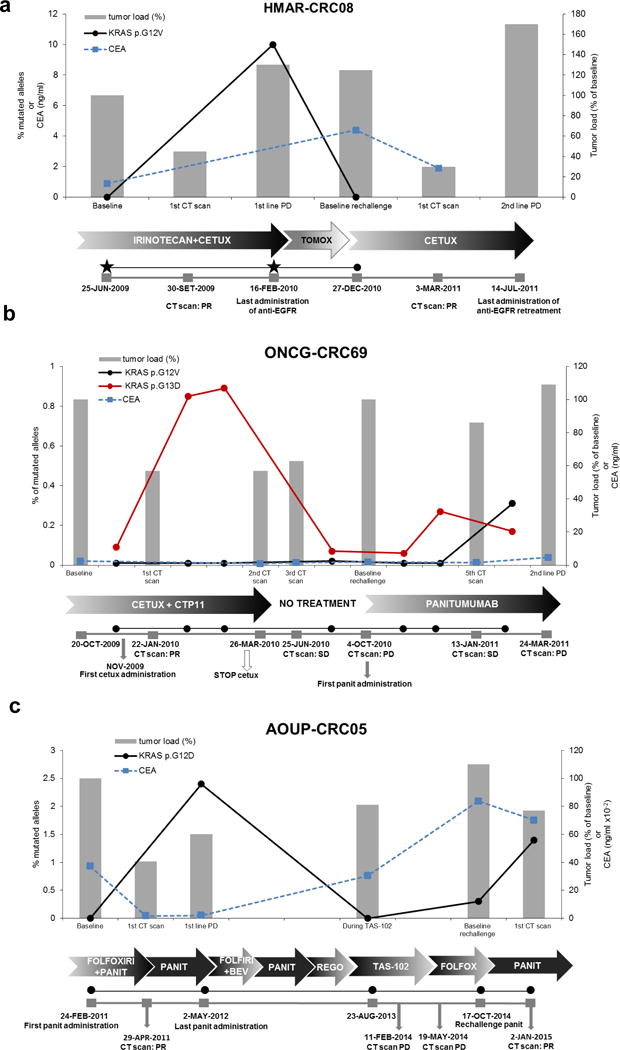
Figure 4. KRAS mutant clones dynamically evolve in response to pulsatile anti-EGFR antibodies therapy.

(a–c) Dynamics of KRAS mutant clones in plasma samples of three CRC patients receiving the indicated therapies. Grey bars represent variation of tumor load, compared to baseline, during treatments as specified below the graphs. Tumor load is calculated as follows: measurable disease at the initiation of treatment (baseline) is assumed as 100%; responses or progression are calculated as % of tumor load as compared to baseline, as per RECIST criteria.
Relevant clinical events are indicated in grey boxes below the individual graphs. Black and red lines indicate the frequency of KRAS mutation (% of alleles), detected in circulating DNA at the indicated time points. Black stars represent analyzed tissue samples. Dotted blue line indicates CEA values. CETUX: cetuximab; PANIT: panitumumab; REGO: regorafenib.
