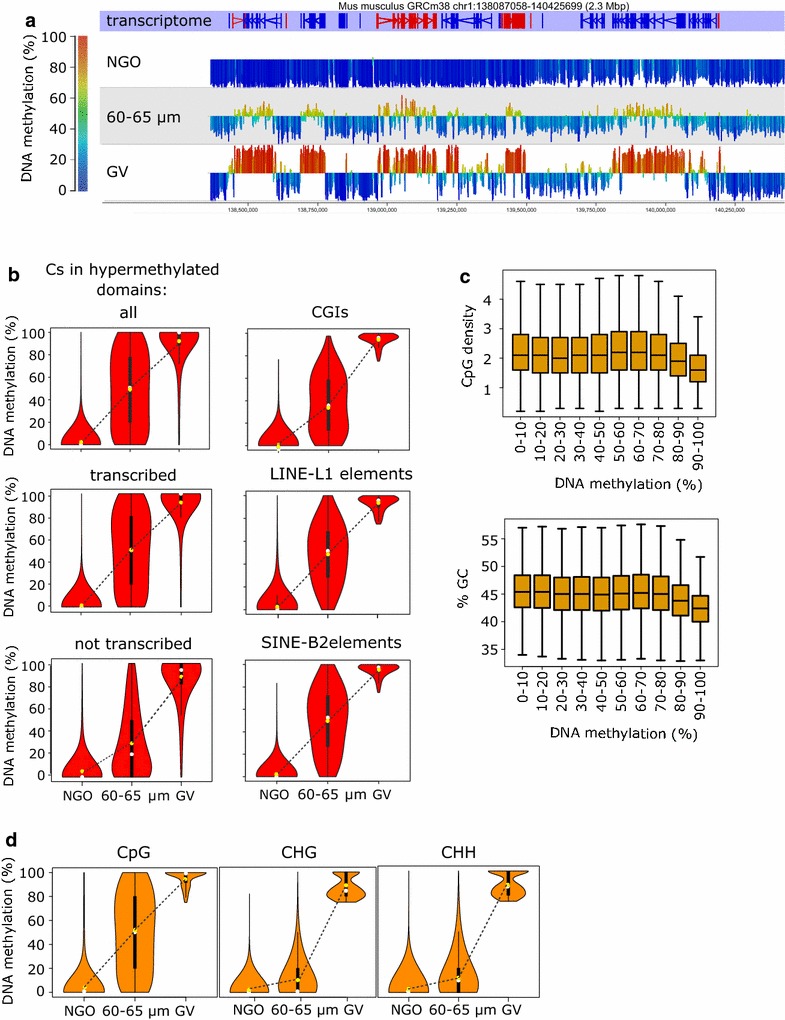
Fig. 1.

Rates of de novo DNA methylation of different sequence features in growing oocytes. a Screenshot of a 2.3-Mb interval of chromosome 1 depicting methylation in NGOs, 60–65 µm and GV oocytes. Vertical bars represent mean methylation of 2-kb windows, with 1-kb steps, height and colour denoting % methylation. The horizontal lines are set at 50% methylation, with higher levels of methylation above the line and lower levels below the line and shaded according to the colour scale on the left. The 60–65 µm data are from PBAT from the current manuscript; NGO and GV data are from [5, 11]. b Violin plots showing distribution of CpG methylation values in all hypermethylated domains, transcribed hypermethylated domains (≥90% of the length of the domain covered by transcript, domains ≥5 kb), transcriptionally silent hypermethylated domains (≤10% of the length of the domain covered by transcript, domains ≥5 kb), CGIs, LINE L1s and SINE-B2s in NGO, 60–65 µm and GV oocytes. Shape of the violin plot represents Kernel density estimation, i.e. probability density of the data at the different values. White dots correspond to the median, yellow dots to the average, bold lines the interquartile range and thin lines adjacent values, i.e. minimum and maximum values within the ×1.5 interquartile range from the first and third quartile, respectively. c Box whisker plots reporting CpG density and GC content of 2-kb genomic regions that are fully methylated in GV oocytes (≥75% DNA methylation) categorised according to their % DNA methylation in 60–65 µm oocytes (x axis). Boxes, interquartile range, with bar as median and whiskers as ×1.5 interquartile range, outliers not shown. Between 3619 and 30320 2-kb intervals were analysed in each methylation category. d Violin plots showing methylation levels of Cs in CpG, CHG and CHH contexts in NGOs and 60–65 µm oocytes of Cs that are fully methylated (≥75%) in GV oocytes
