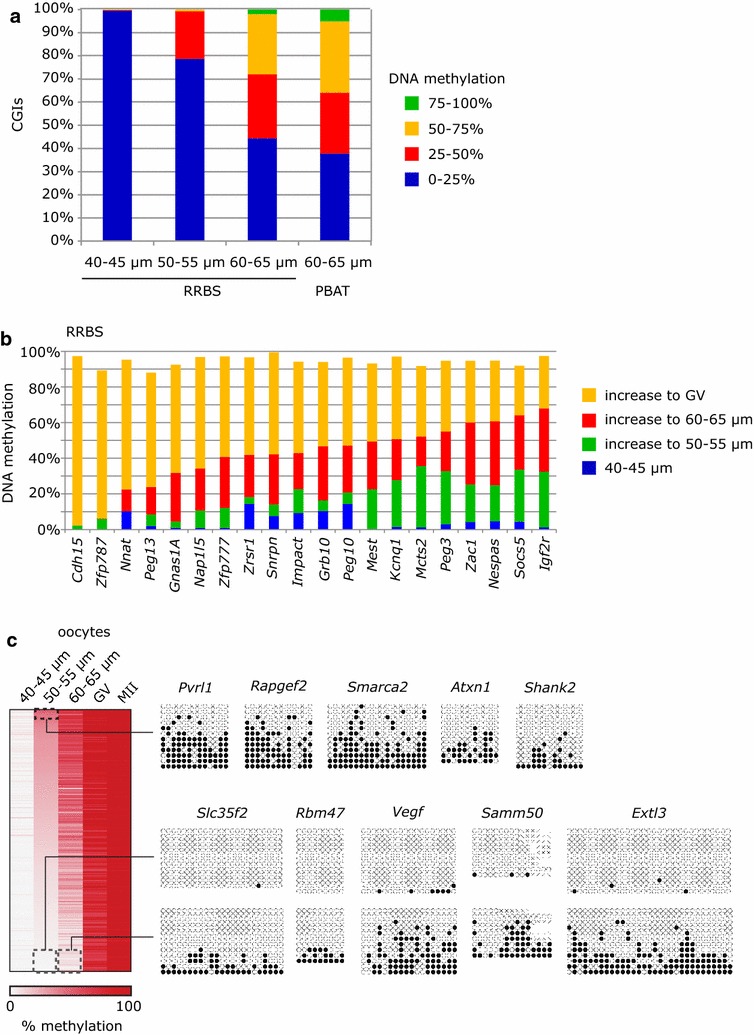
Fig. 3.

CpG islands gain DNA methylation at different rates in growing oocytes. a Barchart of CGI methylation in the oocyte size populations from the RRBS and PBAT datasets. The number of CGIs covered in each dataset is given in Additional file 1: Table S1. b Methylation of gDMRs in RRBS datasets, displaying the basal level in 40–45 µm oocytes, and the increases in methylation to the subsequent size populations. gDMRs are ordered according to their methylation level in 60–65 µm oocytes, which is comparable with PBAT data (see Additional file 3: Fig. S2A). c Validation of CGI methylation in different oocyte size populations. Heatmap shows methylation progression at CGIs that become methylated between 40 and 45 µm and MII oocytes (data from published GV and MII RRBS datasets). Five early-methylating CGIs and five late-methylating CGIs were selected, and their methylation in 50–55 µm oocytes (early-methylating CGIs) or both 50–55 and 60–65 µm oocytes was confirmed by locus-specific bisulphite sequencing. White dots represent unmethylated CpGs and black dots methylated CpGs
