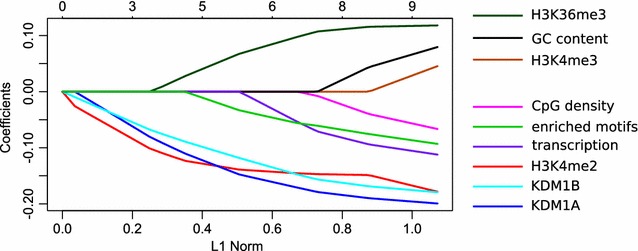
Fig. 8.

Modelling factors determining rate of CpG island methylation. Lasso regression model plot showing the effect of nine independent variables on variability of CGI methylation in 60–65 µm oocytes. Each line represents one of the variables. The earlier the line deviates from the horizontal line with coefficient 0.0, the more the corresponding variable contributes to the variability of the response variable, and the steeper the slope the greater the effect. If the steepness of the slope of one variable already in the model changes when a new variable comes into the model, it is a sign of correlation between two independent variables
