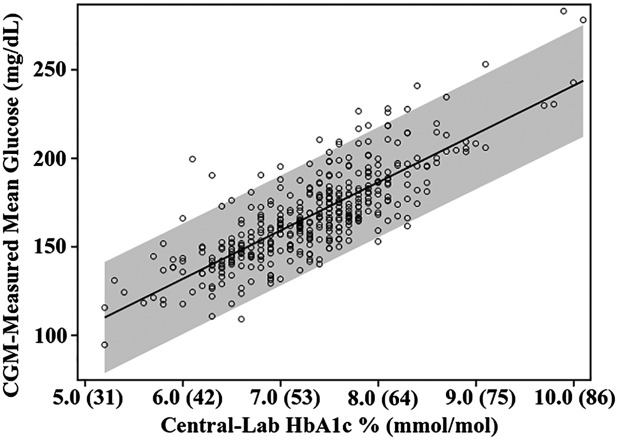
Figure 1.
Plot of CGM-measured mean glucose concentration vs. laboratory-measured HbA1c. The shaded area represents the 95% prediction interval (analogous to an individual CI) for a patient’s mean glucose concentration for a measured HbA1c level, demonstrating the wide range of mean glucose concentration values that are possible for any HbA1c value.

