Figure 4.
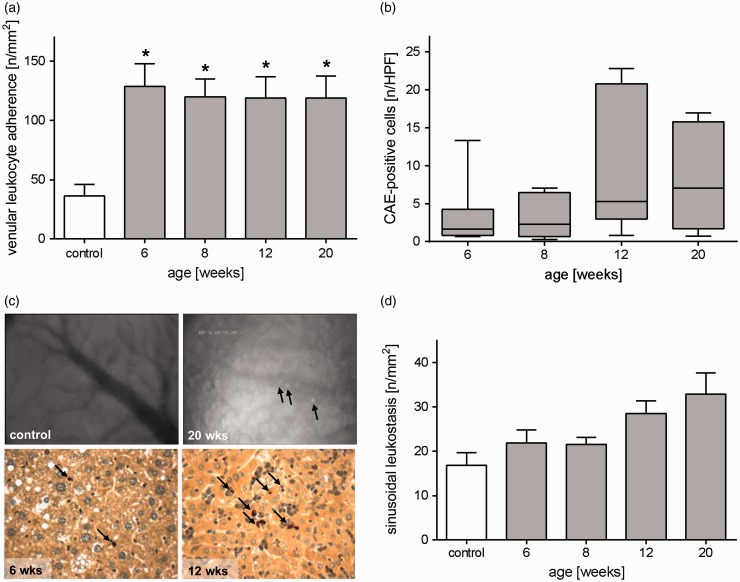
Increased hepatic inflammation during progression of NAFLD. (a) Intravital microscopic analysis of the number of adherent leukocytes in postsinusoidal venules of healthy livers (control) and livers of STZ/HFD-treated mice at ages of 6, 8, 12, and 20 weeks. Values are given as mean±s.e.m. (control: n=9, 6 weeks: n=10, 8 weeks: n=10, 12 weeks: n=10, 20 weeks: n=11). Significance of differences between the groups was tested by one-way ANOVA (Bonferroni t-test), *P<0.05 vs. control. (b) Quantitative analysis of CAE-positive cells in liver sections of STZ/HFD-treated mice (6, 8, 12, and 20 weeks). Data are presented as box plots indicating the median, the interquartile range in form of a box, and the minimum and maximum as whiskers (6 weeks: n=7, 8 weeks: n=7, 12 weeks: n=9, 20 weeks: n=7). (c) Upper panel: Representative in vivo images of the liver of a control and a 20 weeks old STZ/HFD-treated mouse showing numerous leukocytes (arrows) adhering at the endothelium of the venule in the diseased liver (12 weeks) (400× magnification). Lower panel: The images depict representative HPF of CAE-stained liver tissue of 6 and 12 weeks old mice with red stained granulocytes (arrows). (d) Intravital microscopic analysis of sinusoidal leukostasis of healthy livers (control) and livers of STZ/HFD-treated mice at ages of 6, 8, 12, and 20 weeks. Values are given as mean±s.e.m. (control: n=11, 6 weeks: n=10, 8 weeks: n=10, 12 weeks: n=10, 20 weeks: n=10). (A color version of this figure is available in the online journal.)

