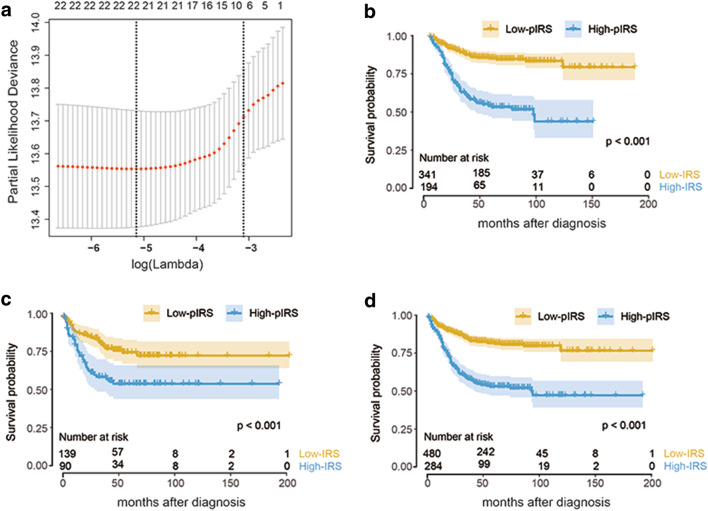
Fig. 2.
pIRS construction and validation. a Partial likelihood deviance of different numbers of variables revealed by the LASSO regression model. The red dots represent the partial likelihood deviance values, the grey lines represent the standard error (SE), the two vertical dotted lines on the left and right, respectively, represent optimal values by minimum criteria and 1-SE criteria. “Lambda” is the tuning parameter. b–d Kaplan–Meier curves of relapse-free survival according to pIRS groups in the training cohort (b), validation cohort (c), and entire cohort (d). pIRS prognostic immune risk score

