Abstract
Perception of hue is opponent, involving the antagonistic comparison of signals from different cone types. For blue versus yellow opponency, the antagonism is first evident at a ganglion cell with firing that increases to stimulation of short wavelength-sensitive (S) cones and decreases to stimulation of middle wavelength-sensitive (M) and long wavelength-sensitive (L) cones. This ganglion cell, termed blue–yellow (B–Y), has a distinctive morphology with dendrites in both ON and OFF strata of the inner plexiform layer (Dacey and Lee, 1994). Here we report the synaptic circuitry of the cell and its spatial density. Reconstructing neurons in macaque fovea from electron micrographs of serial sections, we identified six ganglion cells that branch in both strata and have similar circuitry. In the ON stratum each cell collects ∼33 synapses from bipolar cells traced back exclusively to invaginating contacts from S cones, and in the OFF stratum each cell collects ∼14 synapses from bipolar cells (types DB2 and DB3) traced to basal synapses from ∼20 M and L cones. This circuitry predicts that spatially coincident blue–yellow opponency arises at the level of the cone output via expression of different glutamate receptors. S cone stimuli suppress glutamate release onto metabotropic receptors of the S cone bipolar cell dendrite, thereby opening cation channels, whereas M and L cone stimuli suppress glutamate release onto ionotropic glutamate receptors of DB2 and DB3 cell dendrites, thereby closing cation channels. Although the B–Y cell is relatively rare (3% of foveal ganglion cells), its spatial density equals that of the S cone; thus it could support psychophysical discrimination of a blue–yellow grating down to the spatial cutoff of the S cone mosaic.
Keywords: color opponency, color discrimination, ganglion cell, bipolar cell, S cones, ribbon synapses
Perception of hue is opponent, involving the antagonistic comparison of signals from different cone types (Hurvich and Jameson, 1957; Krauskopf et al., 1982;Lennie and D’Zmura, 1988; Calkins et al., 1992; Webster and Mollon, 1994). Thus, for blue versus yellow opponency, blue is perceived when excitation from S cones exceeds the excitation from M and L cones. Conversely, yellow is perceived when excitation from M and L cones exceeds that from S cones. When the two sources of excitation are appropriately balanced, the perceived hue is neither blue nor yellow and is thus said to be in blue–yellow equilibrium (Hurvich and Jameson, 1957; Larimer et al., 1975; Pugh and Larimer, 1980). Thus, to understand how hue perception is opponent, one needs to know at what stage in the visual pathway and by what mechanism the antagonism S − (M + L) arises.
Blue versus yellow opponency is certainly manifest at primary visual cortex in FMRI data (Engel et al., 1997), and it is manifest in the lateral geniculate body as a single unit with firing that increases to S cone stimuli and decreases to spatially coextensive M and L cone stimuli (Wiesel and Hubel, 1966). However, the first neuron to express spatially coextensive S − (M + L) antagonism is a retinal ganglion cell, one that presumably drives the geniculate neuron (de Monasterio, 1978; Zrenner, 1983a,b). This ganglion cell has been called blue–yellow (B–Y), but this name really represents a hypothesis: its activity is responsible for the opponent perception of blue and yellow hues (Rodieck, 1991).
The B–Y ganglion cell is bistratified, forming one dendritic arbor in the ON stratum of the inner plexiform layer and another arbor in the OFF stratum (Dacey, 1993; Dacey and Lee, 1994). The bistratification suggested a specific wiring: excitation from the ON bipolar cell connected exclusively to S cones (Mariani, 1984; Kouyama and Marshak, 1992; Wässle et al., 1994) and excitation from OFF bipolar cells connected to M and L cones (Boycott and Wässle, 1991). The actual wiring of the B–Y ganglion cell was unknown but seemed critical to identifying the source of the potent psychophysical blue–yellow hue opponency. The spatial density of the B–Y ganglion cell was also unknown but seemed equally critical to assessing whether the mosaic could support perceptual discrimination of the finest blue–yellow gratings.
We investigated the circuitry and spatial density of the B–Y ganglion cell in the macaque fovea. First, we identified a population of bistratified ganglion cells by tracing their dendrites through serial sections photographed in the electron microscope. Then, we traced their synapses from ON bipolar cells back to S cones (Mariani, 1984; Kouyama and Marshak, 1992; Wässle et al., 1994). Finally, we completed the circuit by tracing their synapses from OFF bipolar cells back to M and L cones. Following this procedure, we were able to identify all the B–Y ganglion cells in this patch of fovea and determine their spatial density.
MATERIALS AND METHODS
We analyzed by electron microscopy the foveal retina of an adult male monkey (Macaca fascicularis). The preparation was described previously in detail (Tsukamoto et al., 1992; Calkins et al., 1994, 1996). Consecutive sections (319) were cut vertically at 90 nm along the horizontal meridian just nasal of the foveal center. Each section was photographed en montage at 2000–5000× and printed with an additional magnification of at least 2.8×.
We traced the dendritic tree of each B–Y ganglion cell through the series, noting every synapse from a bipolar cell. Then we traced each bipolar cell synapse back to its axon terminal, establishing the morphology and number of synaptic ribbons. Furthermore, we worked back to the soma location and thence to contacts with cone terminals. Finally, we returned to each bipolar cell axon terminal and traced processes postsynaptic to it, thus determining whether some of these might originate from the B–Y ganglion cells. In this way, we were able to quantify the circuits from cones via bipolar cells to several B–Y ganglion cells. Tracings were transferred onto mylar sheets aligned on a cartoonist’s jig and then digitized and stacked by computer (Montage software package; Smith, 1987).
RESULTS
We analyzed a territory in the inner plexiform layer covering 2300 μm2 in the plane of the retina. The middle of this region was located 600 μm from the foveal center and received input from ∼75 cone terminals (Fig. 1). These were displaced 50 μm toward the foveal center, and their inner segments were further displaced by >300 μm. Thus, the circuits served a patch of the photoreceptor mosaic located 220 μm (1°) from the foveal center.
Fig. 1.
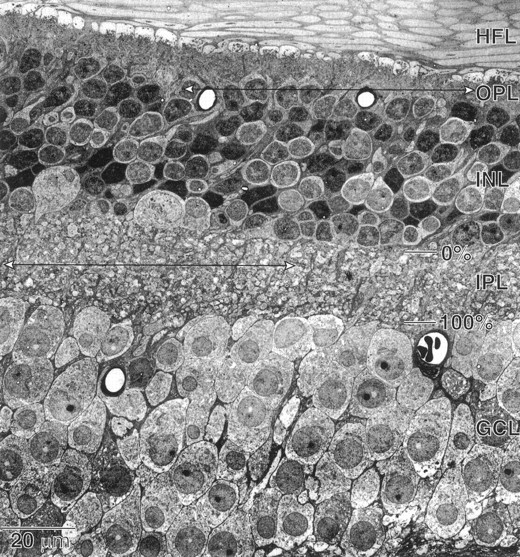
Radial section through macaque fovea (electron micrograph). Top and bottom arrowsindicate the regions studied that connect, respectively, cone terminals to bipolar cell dendrites and bipolar cell axon terminals to ganglion cell dendrites. HFL, Henle fiber layer;OPL, outer plexiform layer; INL, inner nuclear layer; IPL, inner plexiform layer;GCL, ganglion cell layer. The percent depth of the IPL from the INL is indicated. Magnification, 400×.
Ganglion cells associated with S cone bipolar cells
Underlying the territory of these circuits were six or seven tiers of cell somas, including 195 ganglion cells, the dendritic arbors of which we traced into the inner plexiform layer (Fig. 1). Approximately 150 of these arbors belonged to midget ganglion cells, corresponding to one ON and one OFF midget cell for each M and L cone terminal (Calkins et al., 1994). Of the 45 additional ganglion cell arbors, 18 branched in both the ON and OFF strata and, in this sense, were bistratified. Six of these 18 (3% of all the ganglion cells) had a distinctive morphology.
The somas, 10–13 μm in diameter, were set in a middle tier of the ganglion cell layer (Fig.2A). Each produced a single dendritic stalk, ∼3 μm in diameter, that snaked between overlying somas to reach the inner plexiform layer. This primary stalk branched in the ON stratum at a depth of 65–100% and sent multiple dendrites into the OFF stratum at a depth of 15–50% (Fig.2A; see Fig. 5). These ganglion cells, spaced 10–15 μm between nearest neighbors (Fig. 2B), were more diffusely branching than their peripheral counterparts (Dacey, 1993;Dacey and Lee, 1994) and resembled, to a remarkable degree, the shrub ganglion cell drawn from Golgi impregnations by Polyak (1941) andBoycott and Dowling (1969).
Fig. 2.
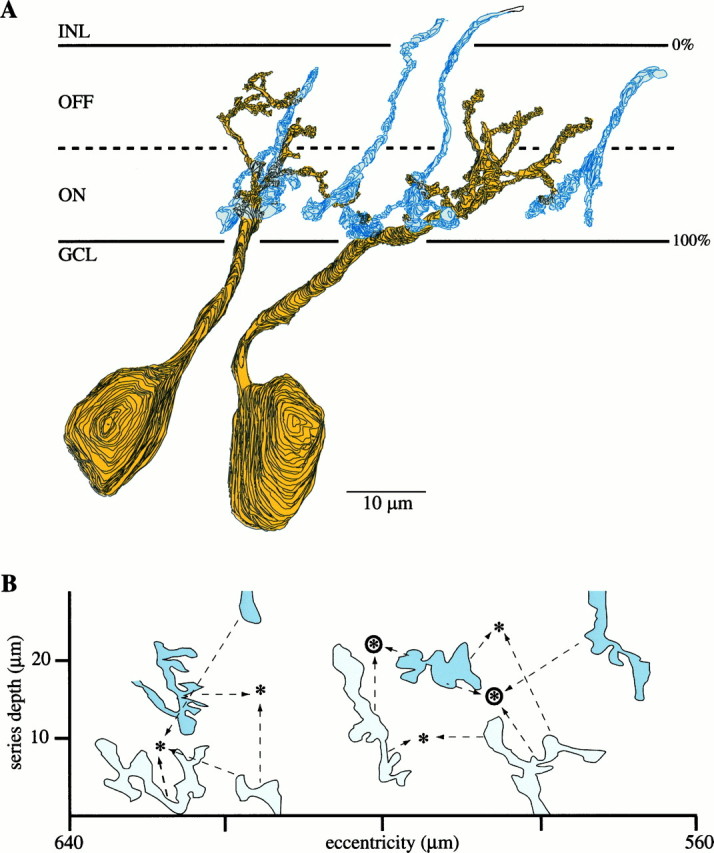
B–Y ganglion cells and S cone bipolar cell terminals (reconstructions from electron micrographs).A, B–Y ganglion cells reconstructed from vertical serial sections (yellow). The dendrites branch in both the ON and OFF strata, entwining in the ON stratum with the terminals of S cone bipolar cells (blue). The actual thickness of the IPL varies across the series (see Fig. 1), so the extended lines marking the GCL and INL indicate its maximum thickness.B, ON stratum of IPL in tangential view with outlines of S cone bipolar cell terminals (pale anddark blue) and locations of B–Y ganglion cell dendritic stalks as they penetrate the IPL from the cell body (asterisks). The axon terminals of several S cone bipolar cells converge on each B–Y cell (arrows). Dark blue terminals were traced all the way back to their dendritic tips and contacts from S cones; pale blue terminals could not be traced that far in the IPL but expressed a similar morphology, stratification, number of ribbon synapses, and connectivity. Circled asterisksmark the locations of the ganglion cells shown in A. The scales for A and B are the same.
Fig. 5.
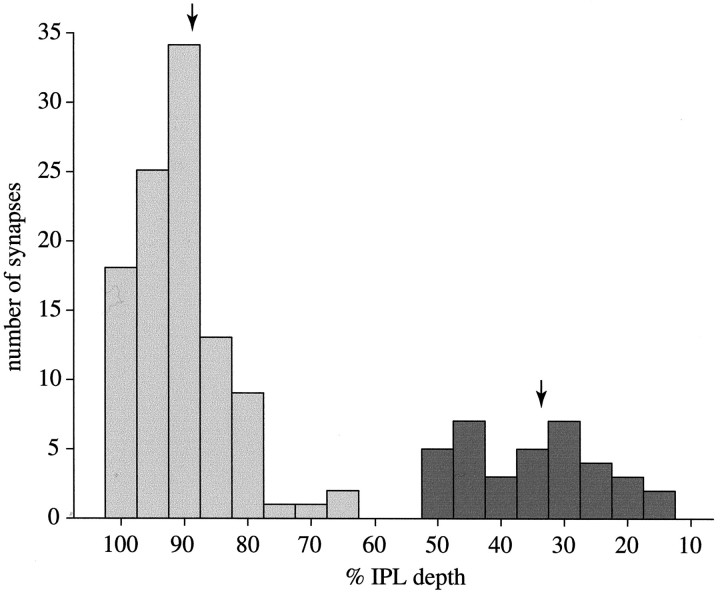
Histogram of 103 synapses from S cone bipolar cell terminals (light bars) and 36 synapses from diffuse OFF bipolar cells (dark bars) to the six B–Y ganglion cells in our series as a function of IPL depth. Arrowsindicate means of 88.9 and 33.3%, respectively.
The ganglion cell dendrites in the ON stratum associated intimately with the axon terminals of S cone bipolar cells (Fig.2B). We identified four of these terminals by tracing them back to somas and thence to their dendritic tips, which were contacted exclusively by S cones. It is well established that the cones contacting this bipolar cell type are indeed S cones (Mariani, 1984;Kouyama and Marshak, 1992; Wässle et al., 1994). Four additional bipolar cells could not be traced this way, because their dendrites left the series, but their axons displayed the same morphology, stratification, and association with the bistratified ganglion cells. Furthermore, all eight bipolar cell terminals shared distinctive synaptic patterns described below, so we infer that all belong to S cone bipolar cells.
Synapses in the ON stratum from S cone bipolar cells
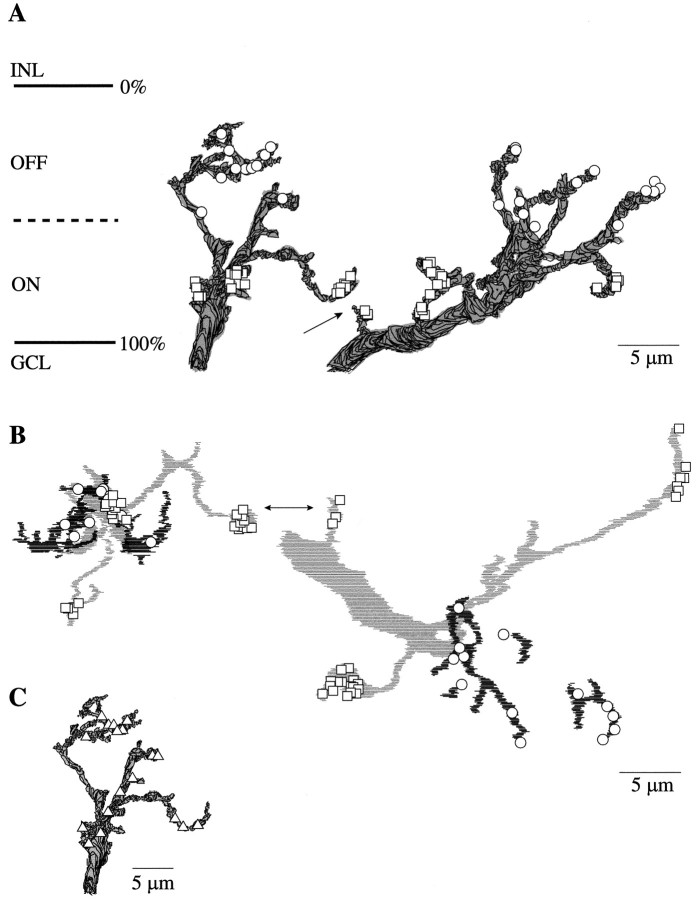
The axon terminals of three complete S cone bipolar cells formed 39, 42, and 44 ribbon synapses. Two others that were nearly complete formed at least 34 and 36 ribbons (see Fig. 6A). These terminals associated intimately with dendrites of the bistratified ganglion cell and provided contacts at ribbon synapses (Fig. 3). The two complete ganglion cells received, respectively, 34 and 32 contacts from these bipolar cell terminals. Contacts were absent from the primary dendritic stalk but clustered on smaller dendritic twigs (Figs.4A,B, 5). These were the only bipolar cell contacts to these ganglion cells in the ON stratum. Thus, the morphology of this ganglion cell type (bistratified dendritic arbor) and its connections in the ON stratum (synapses from S cone bipolar cells) force the conclusion that it is the bistratified B–Y ganglion cell (Dacey and Lee, 1994).
Fig. 6.
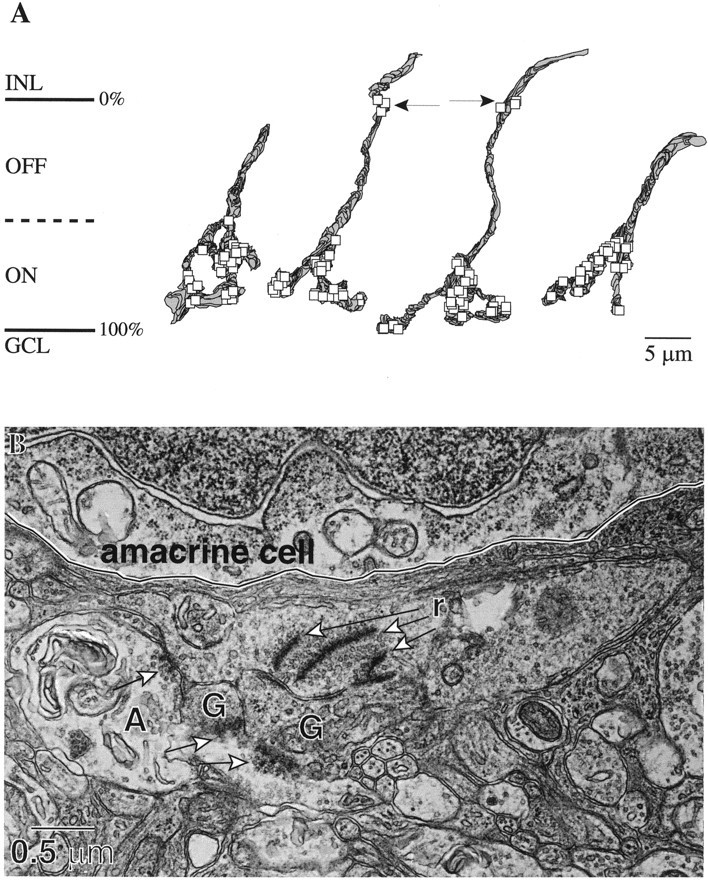
S cone bipolar cell terminals and axons (reconstructions and an electron micrograph). A, Axon terminals of the four S cone bipolar cells showing locations of their presynaptic ribbons (squares). Two complete terminals on the left contained, respectively, 42 and 39 ribbons; two incomplete terminals on the right contained, respectively, 34 and 36 ribbons. Arrows indicate additional ribbons near the INL border. B, Electron micrograph of an S cone bipolar cell axon first penetrating the IPL. This axon contained seven ribbons (r) in the OFF stratum, three of which are shown pointing to two ganglion cell dendrites (G). The amacrine cell process (A) contacts both the axon and the ganglion cell dendrites (thick arrows).
Fig. 3.
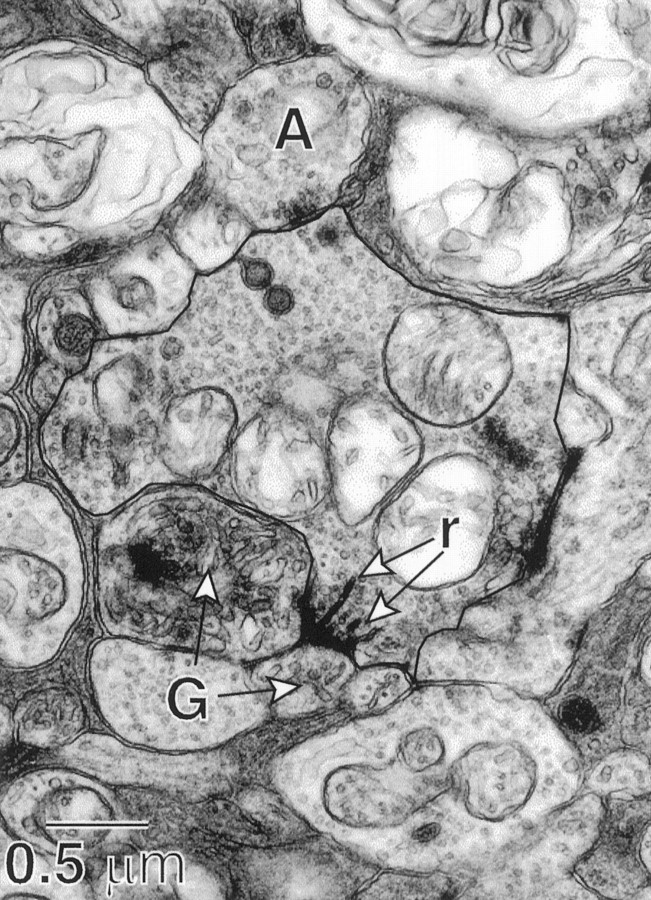
S cone bipolar cell terminal outlined withdark line (high-magnification electron micrograph). Ribbon synapses (r) are presynaptic at a dyad to two ganglion cell dendrites (G). The amacrine cell process (A) is presynaptic to the bipolar cell terminal (dark clustering ofvesicles). The bipolar cell is shown reconstructed in Figure 7A.
Fig. 4.
Dendritic arbors of B–Y ganglion cells and their synapses (reconstructions from electron micrographs). A,B–Y ganglion cell arbors (radial view) showing synapses from S cone bipolar cells (squares) and diffuse cone bipolar cells (circles). The two cells receive, respectively, 34 and 32 contacts from S cone bipolar cells and 15 and 13 contacts from diffuse bipolar cells, but some contacts are hidden by others. Arrow, Synapses from an S cone bipolar cell that contacts both ganglion cells (Fig. 7A). Because the maximum thickness of the IPL across the series is indicated, the actual depths of the synapses are given in Figure 5. B,Tangential view of the same B–Y ganglion cell dendritic trees.ON stratum, Light shading; OFF stratum, dark shading. C, Twenty-one amacrine cell synapses (triangles) to a B–Y ganglion cell distribute about evenly to dendrites in both ON and OFF strata. These synapses rarely arise from amacrine cell processes postsynaptic to an S cone bipolar cell (see Results).
Two or three S cone bipolar cells contributed synapses to each B–Y ganglion cell (Fig. 2B), but a single bipolar cell predominated. Thus one ganglion cell received 71% of its S cone bipolar cell contacts from one terminal and 29% from another (Figs.2A, 4A,left); a second ganglion cell received 65% of its S cone bipolar cell contacts from one terminal, 25% from a second, and 10% from a third (Figs. 2A,4A, right).
We tried to determine whether all S cone bipolar cell synapses are directed to the B–Y ganglion cell or if other ganglion cells and amacrine cells are also _targets. For this we chose an S cone bipolar cell terminal at the middle of the series and traced every postsynaptic process until it was identified or lost. This terminal contained 42 ribbons; at one ribbon there was a single postsynaptic process (monad), and at 41 ribbons there were two postsynaptic processes (dyad), so there were 83 postsynaptic processes total.
Forty-two of the 83 processes postsynaptic to this S cone bipolar cell were confirmed to be ganglion cell dendrites. Thirty were traced back to two B–Y cells, but the remaining 12 left the series. However, 10 of these 12 arose from a single ganglion cell, the dendritic tree of which in the ON stratum resembled that of the B–Y cell. Moreover, in the pool of eight S cone bipolar cells, whenever we could trace a dendrite back to an identified ganglion cell, it always belonged to a B–Y cell (Fig. 2B). Thus we conclude that in the ON stratum the S cone bipolar cell contacts only the B–Y cell.
Twenty of the 83 postsynaptic processes were confirmed by their vesicle content and presynaptic densities to be from amacrine cells. This left only 21 postsynaptic processes that could not be identified for certain because they were too thin to trace. However, 12 of these processes shared a dyad with a confirmed ganglion cell dendrite, and because we never observed a dyad shared by two different ganglion cells, these were probably from amacrine cells. The remaining nine processes were probably ganglion cell dendrites, because they contained neither vesicles nor presynaptic densities. In short, the S cone bipolar cell directs ∼60% of its output to the B–Y ganglion cell and ∼40% to amacrine cell processes.
Approximately half (12 of 20) of the confirmed amacrine cell processes postsynaptic to the S cone bipolar cell terminal formed a synapse back onto the terminal (reciprocal synapse). Only rarely (3 of 20) did a postsynaptic amacrine cell process contact the ganglion cell member of the dyad. This arrangement differs strikingly from the midget bipolar cell circuit where the postsynaptic amacrine cell invariably feeds back to the bipolar cell terminal and also forward to the ganglion cell (Dowling and Boycott, 1966; Calkins and Sterling, 1996). Nevertheless, we identified 21 amacrine cell contacts on a B–Y cell, and these were about evenly distributed between dendrites in both ON and OFF strata (Fig. 4C). Possibly these synapses arise from amacrine cells that show dye coupling to the B–Y cell (Dacey, 1993).
S cone bipolar cell synapses in OFF stratum
Tracing three S cone bipolar cell axons back toward their somas, we observed that they contained synaptic ribbons in the OFF stratum just below the inner nuclear layer (0–10% inner plexiform layer depth). Two of the axons contained three ribbons (Fig.6A), and a third axon contained seven ribbons (Fig. 6B). The postsynaptic complex was structured such that the same process was often postsynaptic at several ribbons (Fig. 6B). We traced about 10 postsynaptic processes until they left the series or were lost because they were exceptionally thin. These processes, which contained no vesicles or presynaptic densities, were probably ganglion cell dendrites. They cannot belong to the B–Y cell, because its dendrites do not reach this level of the OFF stratum (Figs. 2A,4A). Apparently the S cone bipolar cell provides a few synapses in the OFF stratum to a second type of ganglion cell.
Synapses from S cones to the S cone bipolar cell
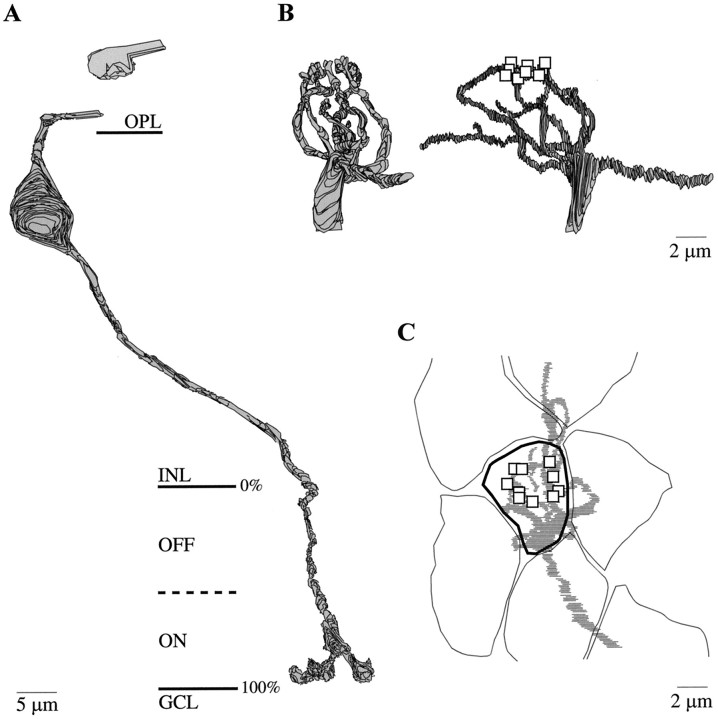
The primary dendritic stalk of the S cone bipolar cell coursed through the inner nuclear layer and branched horizontally on reaching the outer plexiform layer (Fig.7A). On reaching an S cone terminal it branched profusely, sending fine twigs to invaginate the cone terminal (Fig. 7B). Each twig formed the central element of a triad. One S cone bipolar cell, branching beneath a single S cone terminal, formed the central triadic element at 10 of its 22 ribbons (Fig. 7B) (Kouyama and Marshak, 1992; Wässle et al., 1994). However, because three or four of the dendritic twigs of this cell under the S cone could not be traced, the actual number of central elements it contributes is probably ∼15. Two other fine dendrites snaked horizontally beneath surrounding M and L cone terminals, reaching for additional S cones beyond the series. The central elements of all S cone triads are occupied by S cone bipolar cell dendrites (Herr et al., 1996), and each S cone diverges to one to five of these bipolar cells, whereas each bipolar cell generally collects from one to three S cones (Kouyama and Marshak, 1992; Wässle et al., 1994). Thus, the S cone bipolar cell in the fovea collects at least 70% of its input from one S cone and the rest from one or two others.
Fig. 7.
Complete S cone bipolar cell and a dendritic tree (reconstructions). A, S cone bipolar cell with dendrites running beneath M and L cone terminals (one shown) to penetrate an S cone terminal (data not shown). The axon contacts the B–Y ganglion cells shown in Figure 2A at the synapses indicated by arrows in Figure4A,B. B, Radial views of another S cone bipolar cell dendritic tree. The dendritic tips form central (invaginating) elements at 10 ribbons (squares) at one S cone terminal, but this number is probably low, because some dendrites under this same cone terminal could not be traced. C,Tangential view of same dendritic arbor shows the primary stalk branching extensively beneath the S cone terminal (thick outline) and two thin branches running beneath M and L terminals toward distant S cone terminals.
This result, coupled with our observation that ∼70% of the synapses to the B–Y ganglion cell in the ON stratum are from a single S cone bipolar cell, indicates that the short-wavelength input to the ganglion cell from a single S cone is far greater than that from either of one or two others. However, this circuit clearly differs from that of the midget ganglion cell, in which there is no convergence at all from cone to ganglion cell (Calkins et al., 1994).
Synapses from diffuse bipolar cells in the OFF stratum
The dendritic arbor of the B–Y ganglion cell in the OFF stratum was centered over its arbor in the ON stratum, but the OFF arbor was narrower (Fig. 4B); this is similar to the dendritic tree of more peripheral cells (Dacey and Lee, 1994). Correspondingly, the OFF arbor received fewer than half as many ribbon synapses as the ON arbor; for the two cells in Figures 2A and 4, there were 15 and 13 ribbon synapses. The B–Y ganglion cell dendrites generally contributed only a single element to the dyad; the other element belonged to a different type of ganglion cell or an amacrine cell.
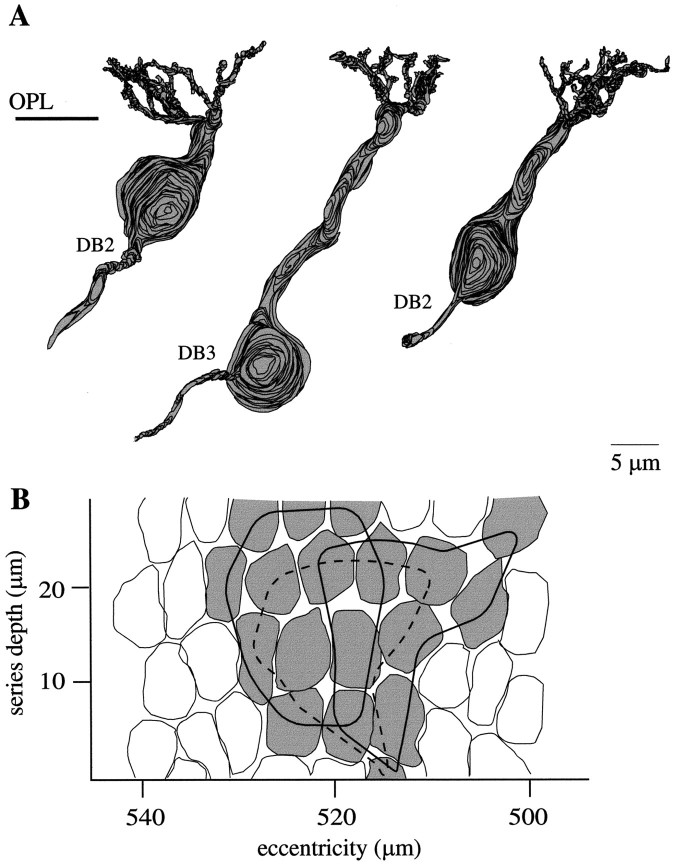
The OFF bipolar cell synapses to the B–Y ganglion cell were contributed by two different types of bipolar cell, as defined by Cohen and Sterling (1990, 1991). One type had a soma low in the inner nuclear layer (Fig. 8). Its thin axon, 0.5–0.7 μm diameter, led to a terminal that stratified narrowly at 35–50% inner plexiform layer depth and contained 63 synaptic ribbons. The second type had a soma at midlevel in the inner nuclear layer. Its thick axon, 1.0–1.5 μm in diameter, led to a terminal that arborized diffusely at 10–50% inner plexiform layer depth and contained 53 ribbons. These two bipolar cell types correspond by morphology and axonal stratification to DB3 and DB2, named by Boycott and Wässle (1991).
Fig. 8.
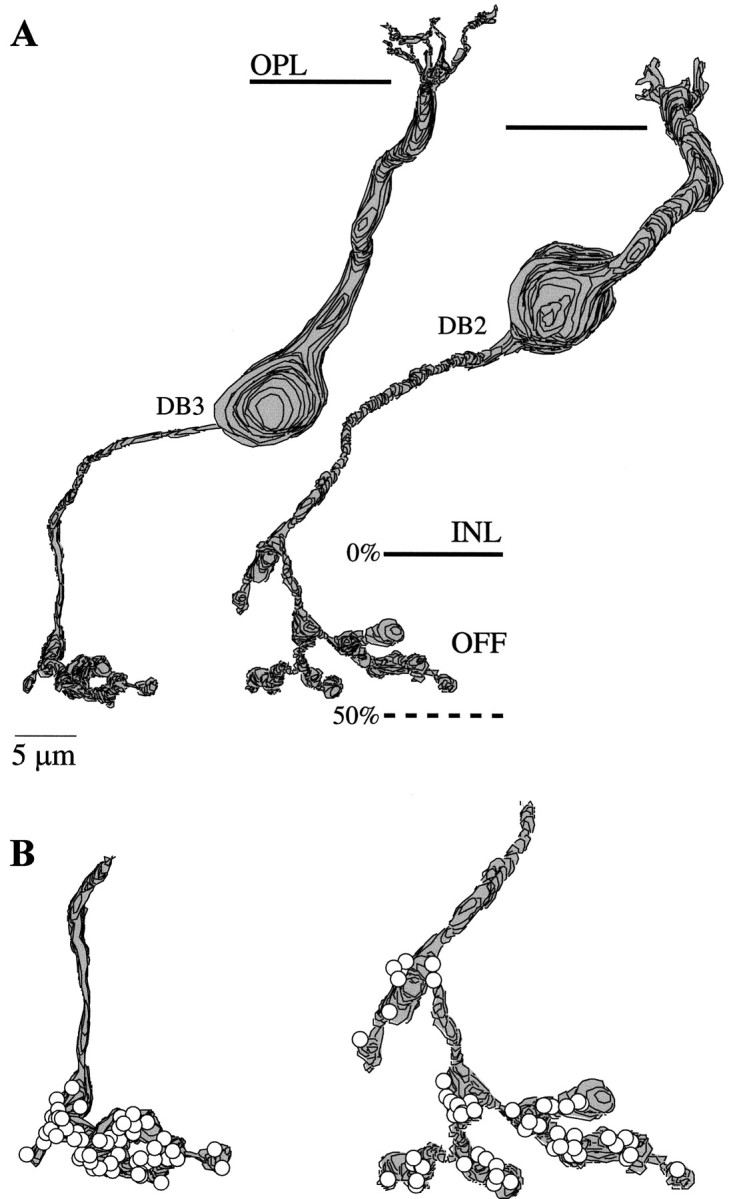
Diffuse bipolar cells and their axon terminals (reconstructions). A, Two types of diffuse bipolar cell are shown. Left, Soma low in the INL and thin axon branching narrowly deep in the OFF stratum; right, soma at middle INL and thicker axon branching diffusely in the OFF stratum. These types correspond morphologically to DB3 and DB2 (Boycott and Wässle, 1991). B, The axon terminals form, respectively, 63 and 53 ribbons (circles).
Two DB2 cells provided four synapses, and a single DB3 cell provided 11 synapses to one B–Y ganglion cell (Figs. 2A,4A,left). DB2 cells provided at least five synapses to another B–Y ganglion cell (Figs. 2B,4A, right). The remaining eight synapses might be DB2 or DB3, but they could not be identified because their terminals left the series. Thus, based on two complete B–Y ganglion cells, ∼30% of the OFF bipolar synapses arise from two or three DB2 cells, and ∼70% arise from one or two DB3 cells.
Cone input to diffuse OFF bipolar cells
In the fovea, DB2 dendrites receive input from M and L cones at both semi-invaginating and basal contacts, whereas DB3 dendrites receive input at only basal contacts (Calkins et al., 1995). This difference permitted us to identify neighboring DB2 and DB3 cells, although their axon terminals left the series, and thus to determine the number of cones that converge on them. Two neighboring DB2 cells and one DB3 cell collected, respectively, from 12, 10, and 10 cone terminals (Fig. 9). The three bipolar cell dendritic trees overlapped considerably, so together they collected from 18 cone terminals. Because in aggregate three or four DB2 and DB3 cells contact a B–Y ganglion cell, we estimate that the total input from OFF bipolar cells arises from ∼20 M and L cones.
Fig. 9.
Dendritic trees of diffuse bipolar cells (reconstructions). A, Neighboring diffuse OFF bipolar cells: one DB3 and two DB2 cells (radial view). B,Tangential view showing cone terminals that contact the bipolar cells in A. Each dendritic tree (outlined) collects from 10–12 cones with considerable overlap between adjacent arbors. A B–Y ganglion cell collects from three or four diffuse cells; therefore, its OFF receptive field encompasses ∼20 M and L cones.
DISCUSSION
Anatomical wiring explains receptive field of the B–Y cell
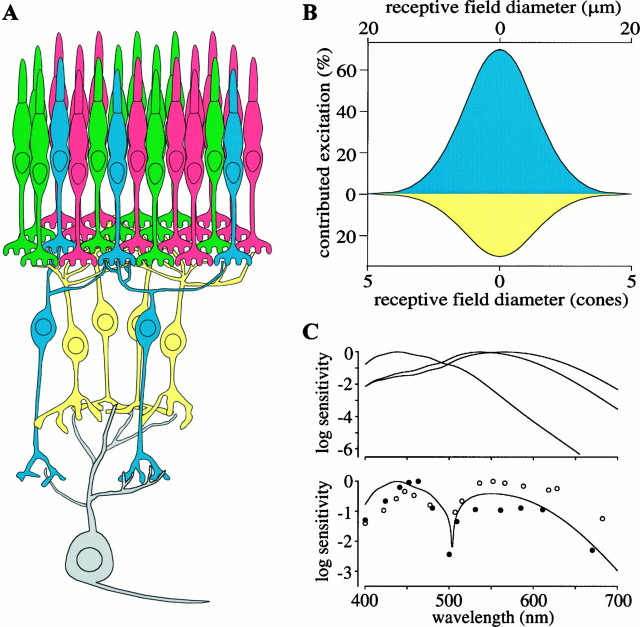
When the B–Y receptive field was assigned by intracellular recording and tracer injection to a bistratified ganglion cell, there were strong predictions about the underlying circuitry (Dacey and Lee, 1994). Excitation at onset of a blue light was attributed to synapses from the ON S cone bipolar cell, and excitation at offset of a yellow light was attributed to synapses from OFF M + L cone bipolar cells. The synaptic circuitry described here strongly confirms these predictions (Fig.10). The bistratified ganglion cell in the fovea (perhaps Polyak’s shrub cell) does indeed receive many synapses (∼33) from the S cone bipolar cell and fewer synapses (∼14) from diffuse OFF bipolar cells. Because all bipolar cell synapses apparently release glutamate (Massey, 1990), and all ganglion cells probably express ionotropic glutamate receptors (Cohen and Miller, 1994; Zhou et al., 1994; Peng et al., 1995; Qin and Pourcho, 1995; Lukasiewicz et al., 1997), both the S cone bipolar cell and M + L cone bipolar cells probably excite the B–Y ganglion cell.
Fig. 10.
Summary of the presynaptic circuitry of the B–Y ganglion cell and its receptive field. A, B–Y ganglion cell collects mostly from one S cone via two or three S cone bipolar cells (blue) and from 20 M and L cones via three or four DB2 and DB3 cells (yellow).B, Estimated receptive field of B–Y ganglion cell contains spatially coextensive regions excited by onset of S cone stimuli (blue) and offset of M and L cone stimuli (yellow). C, Top graph, Spectral sensitivity of S, M, and L cones (Baylor et al., 1987) corrected for absorption by optical media (Wyszecki and Stiles, 1983); S cone spectral sensitivity extrapolated by linear regression for wavelengths >600 nm. Bottom graph, Spectral sensitivity of B–Y cell calculated as the absolute difference between S and M + L. Calculation assumes that M and L cones are present in equal numbers and scales the S and M + L signals according to their numbers of synapses at the ganglion cell. This computed spectral sensitivity matches the spectral sensitivity of two different data sets for B–Y cells (filled and open circles), replotted from Zrenner (1983a,b). In B, theblue onset region represents the receptive field of a single S cone. This was modeled as a Gaussian point spread with a full width at half-height of 2.7 cones, based on a cutoff frequency of 7–14 cycles/degree for optical modulation of short wavelengths (Williams et al., 1993; Marimont and Wandell, 1994) and for S cone-mediated acuity (Stromeyer et al., 1978; Williams et al., 1983; Mullen, 1985; Sekiguchi et al., 1993). Its amplitude was set by the percentage of excitatory synapses contributed to the ganglion cell by S cone bipolar cells (70%). The yellow offset region represents the receptive field of a patch of 20 M and L cones. Each cone receptive field was modeled as a Gaussian point spread with a full width at half-height of 0.49 cones, based on psychophysical measurements of the human optical point spread function (MacLeod et al., 1992). This was convolved with an exponential with a space constant of 1.5 cones for electrical blurring via gap junctions (Hsu and Sterling, 1995). The 20 cones were distributed as in Figure9B and summed with a relative contribution for each of one, 0.67 or 0.33, determined by whether the cone was presynaptic to three, two, or one diffuse OFF bipolar cells. The amplitude of the smoothed sum was set by the percentage of excitatory synapses contributed by diffuse OFF bipolar cells (30%). We assumed a conversion of 220 μm/1° for monkey fovea and a cone spacing at 1° of ∼4 μm (Samy and Hirsch, 1989; Wässle et al., 1990).
It might seem surprising that the S and M + L cone receptive fields of this ganglion cell are spatially coextensive (Wiesel and Hubel, 1966;Zrenner, 1983a,b; Dacey, 1996), in view of their great difference in cone convergence. Whereas the ON dendritic arbor collects mainly from one S cone with smaller contributions from one or two others (Fig. 7) (Kouyama and Marshak, 1992; Wässle et al., 1994), the OFF dendritic arbor collects from a total of ∼20 M and L cones (Fig. 9). However, there may be no real discrepancy. Because chromatic aberration strongly blurs the retinal image at short wavelengths (Williams et al., 1993; Marimont and Wandell, 1994), the S cone receptive field is effectively broadened, corresponding approximately to the dendritic spread of the B–Y cell in the ON stratum and thereby matching that of 20 M and L cones (Fig. 10B).
Site and molecular basis for blue–yellow hue opponency
The antagonism between S cone and M + L cone signals manifested by the B–Y ganglion cell most likely arises at the cone→bipolar cell synapses. The molecular mechanism seems assignable to the expression of different glutamate receptors by two classes of bipolar cell. The invaginating dendrites of the S cone bipolar cell express metabotropic glutamate receptor 6. We know this because the invaginating dendrites at all cone terminals in macaque retina express this receptor (Vardi et al., 1998). The noninvaginating dendrites of the diffuse bipolar cells probably express ionotropic glutamate receptors (Calkins et al., 1996; Euler et al., 1996;Hartveit, 1997; Vardi et al., 1998). On suppression of glutamate release by light, the metabotropic receptor opens cation channels, whereas the ionotropic receptor closes cation channels.
Consequently, when glutamate concentration decreases at both receptor types, their currents are opposed. However, the S cone bipolar cell should have about twice the effect at the B–Y ganglion cell as the M + L cone bipolar cells, because it provides approximately twice as many synapses. Allowing for this in subtracting (M + L) from S signals predicts a neutral point near 500 nm for the B–Y ganglion cell. That is, the steady firing rate of the cell should be unaffected by modulating the intensity of a 500 nm spectral light, and that is what the recordings show (Fig. 10C) (Zrenner, 1983a,b). This 500 nm light we see as neither blue nor yellow; i.e., it is perceptually in blue–yellow equilibrium (Larimer et al., 1975). So, the key neural mechanism that causes perceptual opponency may reduce simply to signals of opposite sign generated at the first synapse by different classes of glutamate receptor.
Spectral antagonism represents efficient packaging of color information
Why should the spectral antagonism that underlies hue opponency be established at the first visual synapse? Perhaps because the great overlap in spectral sensitivity between different cone types causes the spectral component of the postreceptoral retinal image to vary little in space or time (Buchsbaum and Gottschalk, 1983). This redundancy would tend to degrade transmission of the spectral component, because neurons are both noisy and of limited dynamic range (Laughlin, 1989;Tsukamoto et al., 1990; Atick, 1992). An efficient coding scheme would reduce spectral redundancy by using the difference between the S and M + L cone signals to fill the dynamic range of the ganglion cell (Laughlin, 1989).
Indeed, this is exactly how the excitatory inputs are arranged. Seventy percent of the excitatory synapses to a B–Y cell code the presence of one spectral band, whereas 30% code the absence of a different spectral band (Fig. 10B). Consequently the dynamic range of the the B–Y cell is best filled when the local ratio of S/(M + L) is at least 2:1. Perhaps this ratio is optimized for commonly encountered ratios of these wavelengths in natural scenes (Laughlin, 1981; Webster and Mollon, 1997). Put another way, the quantum catch of the S cone in broad-band light is relatively low; therefore, boosting its gain places the neutral point of the B–Y cell nearer to middle wavelengths, where it would be most useful (Fig. 10) (Buchsbaum and Gottschalk, 1983). Thus the reason we perceive a blue–yellow equilibrium for a spectral light near 500 nm under neutral adaptation (Hurvich and Jameson, 1957; Larimer et al., 1975) may simply be that it is the most efficient way to code the natural scenes inhabited by our ancestors.
The B–Y ganglion cell mosaic can support blue–yellow color discrimination
One reason to doubt that the B–Y cell constitutes the first stage of a pathway for hue perception has been that ganglion cells with spatially coextensive ON and OFF receptive field regions are rarely encountered by microelectrodes (Lee, 1996). Indeed, we found the B–Y cell to form only 3% of all foveal ganglion cells, but it does not follow that this small fraction cannot support hue discrimination. Even when chromatic aberrations are corrected, humans can discriminate blue–yellow gratings no finer than 7–14 cycles/degree (Stromeyer et al., 1978; Williams et al., 1983; Mullen, 1985; Sekiguchi et al., 1993). This limit corresponds to the Nyquist limit for the densest region of the S cone mosaic, which occurs at 1° eccentricity (Williams et al., 1981; Curcio et al., 1991). We find in this region of macaque retina that the spatial density of the B–Y cell equals that of the S cone. So, if the human circuit resembles that of the macaque, the B–Y ganglion cell mosaic would support discrimination of the finest blue–yellow grating.
Conceivably, additional ganglion cell types could contribute to the perception of blue and yellow. For example, there are reports of ganglion cells with an S-OFF/(M + L)-ON receptive field (Lee, 1996), and anatomy shows that every S cone connects, via a midget bipolar cell, to a midget OFF ganglion cell (Klug et al., 1992, 1993). Thus, the spatial density of this type must equal that of the B–Y cell described here. The S-OFF center of this midget ganglion cell would be opposed by the H2 horizontal cell that connects to S, M, and L cones (Dacey et al., 1996). Whether this cell with mixed antagonism, i.e., S − (S + M + L), contributes to hue perception or simply to S cone-mediated spatial perception remains to be determined.
Footnotes
This work was supported by National Institutes of Health Grant EY08124. We thank S. J. Schein for his collaboration in gathering this material, P. Masarachia and S. Shrom for their skillful sectioning photography, S. Fina for help with the preparation of this manuscript, and an anonymous reviewer and E. N. Pugh Jr for their insightful suggestions.
Correspondence should be addressed to Dr. David J. Calkins, Zanvyl Krieger Mind/Brain Institute, Johns Hopkins University, Baltimore, MD 21218-2685.
REFERENCES
- 1.Atick JJ. Could information theory provide an ecological theory of sensory processing? Network. 1992;3:213–251. doi: 10.3109/0954898X.2011.638888. [DOI] [PubMed] [Google Scholar]
- 2.Baylor DA, Nunn BJ, Schnapf JL. Spectral sensitivity of cones of the monkey Macaca fascicularis. J Physiol (Lond) 1987;390:145–160. doi: 10.1113/jphysiol.1987.sp016691. [DOI] [PMC free article] [PubMed] [Google Scholar]
- 3.Boycott BB, Dowling JE. Organization of the primate retina: light microscopy. Philos Trans R Soc Lond B Biol Sci. 1969;255:109–184. doi: 10.1098/rspb.1966.0086. [DOI] [PubMed] [Google Scholar]
- 4.Boycott BB, Wässle H. Morphological classification of bipolar cells of the primate retina. Eur J Neurosci. 1991;3:1069–1088. doi: 10.1111/j.1460-9568.1991.tb00043.x. [DOI] [PubMed] [Google Scholar]
- 5.Buchsbaum G, Gottschalk A. Trichromacy, opponent colours coding and optimum colour information transmission in the retina. Proc R Soc Lond B Biol Sci. 1983;220:89–113. doi: 10.1098/rspb.1983.0090. [DOI] [PubMed] [Google Scholar]
- 6.Calkins DJ, Sterling P. Absence of spectrally specific lateral inputs to midget ganglion cells in primate retina. Nature. 1996;381:613–615. doi: 10.1038/381613a0. [DOI] [PubMed] [Google Scholar]
- 7.Calkins DJ, Thornton JE, Pugh EN. Monochromatism determined at a long-wavelength/middle-wavelength cone-anatagonistic locus. Vision Res. 1992;32:2349–2367. doi: 10.1016/0042-6989(92)90098-4. [DOI] [PubMed] [Google Scholar]
- 8.Calkins DJ, Schein S, Tsukamoto Y, Sterling P. M and L cones in macaque fovea connect to midget ganglion cells via different numbers of excitatory synapses. Nature. 1994;371:70–72. doi: 10.1038/371070a0. [DOI] [PubMed] [Google Scholar]
- 9.Calkins DJ, Schein S, Sterling P. Cone inputs to three types of non-midget ganglion cell in macaque fovea. ARVO Abstr. 1995;36:15. [Google Scholar]
- 10.Calkins DJ, Tsukamoto Y, Sterling P. Foveal cones form basal as well as invaginating contacts with diffuse ON bipolar cells. Vision Res. 1996;36:3373–3381. doi: 10.1016/0042-6989(95)00333-9. [DOI] [PubMed] [Google Scholar]
- 11.Cohen E, Sterling P. Demonstration of cell types among cone bipolar neurons of cat retina. Philos Trans R Soc Lond B Biol Sci. 1990;330:305–321. doi: 10.1098/rstb.1990.0201. [DOI] [PubMed] [Google Scholar]
- 12.Cohen E, Sterling P. Microcircuitry related to the receptive field center of the on- beta ganglion cell. J Neurophysiol. 1991;65:352–359. doi: 10.1152/jn.1991.65.2.352. [DOI] [PubMed] [Google Scholar]
- 13.Cohen ED, Miller RF. The role of NMDA and non-NMDA excitatory amino acid receptors in the functional organization of primate retinal ganglion cells. Vis Neurosci. 1994;11:317–332. doi: 10.1017/s0952523800001668. [DOI] [PubMed] [Google Scholar]
- 14.Curcio CA, Allen KA, Sloan KR, Lerea CL, Hurley JB, Klock IB, Milam AH. Distribution and morphology of human cone photoreceptors stained with anti-blue opsin. J Comp Neurol. 1991;312:610–624. doi: 10.1002/cne.903120411. [DOI] [PubMed] [Google Scholar]
- 15.Dacey DM. Morphology of a small field bistratified ganglion cell type in the macaque and human retina. Vis Neurosci. 1993;10:1081–1098. doi: 10.1017/s0952523800010191. [DOI] [PubMed] [Google Scholar]
- 16.Dacey DM. Circuitry for color coding in the primate retina. Proc Natl Acad Sci USA. 1996;93:582–588. doi: 10.1073/pnas.93.2.582. [DOI] [PMC free article] [PubMed] [Google Scholar]
- 17.Dacey DM, Lee BB. The “blue-on” opponent pathway in primate retina originates form a distinct bistratified ganglion cell type. Nature. 1994;367:731–735. doi: 10.1038/367731a0. [DOI] [PubMed] [Google Scholar]
- 18.Dacey DM, Lee BB, Stafford DK, Pokorny J, Smith VC. Horizontal cells of the primate retina: cone specificity without spectral opponency. Science. 1996;271:656–659. doi: 10.1126/science.271.5249.656. [DOI] [PubMed] [Google Scholar]
- 19.Dowling JE, Boycott BB. Organization of the primate retina: electron microscopy. Proc R Soc Lond B Biol Sci. 1966;166:80–111. doi: 10.1098/rspb.1966.0086. [DOI] [PubMed] [Google Scholar]
- 20.Engel S, Zhang X, Wandell B. Colour tuning in human visual cortex measured with functional magnetic resonance imaging. Nature. 1997;388:68–71. doi: 10.1038/40398. [DOI] [PubMed] [Google Scholar]
- 21.Euler T, Schneider H, Wässle H. Glutamate responses of bipolar cells in a slice preparation of the rat retina. J Neurosci. 1996;16:2934–2944. doi: 10.1523/JNEUROSCI.16-09-02934.1996. [DOI] [PMC free article] [PubMed] [Google Scholar]
- 22.Hartveit E. Cone bipolar cells in rat retina. J Neurophysiol. 1997;77:1716–1730. doi: 10.1152/jn.1997.77.4.1716. [DOI] [PubMed] [Google Scholar]
- 23.Herr SS, Tiv N, Sterling P, Schein SJ. S cones in macaque fovea are invaginated by one type of ON bipolar cell, but L and M cones are invaginated by midget and diffuse bipolar cells. ARVO Abstr. 1996;37:4864. [Google Scholar]
- 24.Hsu A, Sterling P. Coupling between foveal cones improves contrast sensitivity for an ideal observer. Soc Neurosci Abstr. 1995;21:509. [Google Scholar]
- 25.Hurvich LM, Jameson D. An opponent-process theory of color vision. Psychol Rev. 1957;64:384–404. doi: 10.1037/h0041403. [DOI] [PubMed] [Google Scholar]
- 26.Klug K, Tiv N, Tsukamoto Y, Sterling P, Schein SJ. Blue cones contact OFF-midget bipolar cells. Soc Neurosci Abstr. 1992;19:351.7. [Google Scholar]
- 27.Klug K, Tsukamoto Y, Sterling P, Schein SJ. Blue cone off-midget ganglion cells in Macaque. ARVO Abstr. 1993;34:1398. [Google Scholar]
- 28.Kouyama N, Marshak DW. Bipolar cells specific for blue cones in the Macaque retina. J Neurosci. 1992;12:1233–1252. doi: 10.1523/JNEUROSCI.12-04-01233.1992. [DOI] [PMC free article] [PubMed] [Google Scholar]
- 29.Krauskopf J, Williams DR, Heeley DW. Cardinal directions in color space. Vision Res. 1982;22:1123–1131. doi: 10.1016/0042-6989(82)90077-3. [DOI] [PubMed] [Google Scholar]
- 30.Larimer J, Krantz DH, Cicerone CM. Opponent process additivity. II. Yellow/blue equilibria and nonlinear models. Vision Res. 1975;15:723–731. doi: 10.1016/0042-6989(75)90291-6. [DOI] [PubMed] [Google Scholar]
- 31.Laughlin S. A simple coding procedure enhances a neuron’s information capacity. Z Naturforsch [C] 1981;36:910–912. [PubMed] [Google Scholar]
- 32.Laughlin SB. Coding efficiency and design in visual processing. In: Stavenga DG, Hardie RC, editors. Facets of vision. Springer; Berlin: 1989. pp. 213–234. [Google Scholar]
- 33.Lee BB. Receptive field structure in the primate retina. Vision Res. 1996;36:631–644. doi: 10.1016/0042-6989(95)00167-0. [DOI] [PubMed] [Google Scholar]
- 34.Lennie P, D’Zmura M. Mechanisms of color vision. Crit Rev Neurobiol. 1988;3:333–400. [PubMed] [Google Scholar]
- 35.Lukasiewicz PD, Wilson JA, Lawrence JE. AMPA-preferring receptors mediate excitatory synaptic inputs to retinal ganglion cells. J Neurophysiol. 1997;77:57–64. doi: 10.1152/jn.1997.77.1.57. [DOI] [PubMed] [Google Scholar]
- 36.MacLeod DIA, Williams DR, Makous W. A visual nonlinearity fed by single cones. Vision Res. 1992;32:347–363. doi: 10.1016/0042-6989(92)90144-8. [DOI] [PubMed] [Google Scholar]
- 37.Mariani AP. Bipolar cells in monkey retina selective for the cones likely to be blue-sensitive. Nature. 1984;308:184–186. doi: 10.1038/308184a0. [DOI] [PubMed] [Google Scholar]
- 38.Marimont DH, Wandell BA. Matching color images: the effects of axial chromatic aberration. J Opt Soc Am A. 1994;11:3113–3122. [Google Scholar]
- 39.Massey SC. Cell types using glutamate as a neurotransmitter in the vertebrate retina. In: Osborne NN, Chader G, editors. Progress in retinal research, Vol 9. Pergamon; London: 1990. pp. 399–425. [Google Scholar]
- 40.de Monasterio FM. Properties of ganglion cells with atypical receptive-field organization in retina of macaques. J Neurophysiol. 1978;41:1435–1449. doi: 10.1152/jn.1978.41.6.1435. [DOI] [PubMed] [Google Scholar]
- 41.Mullen KT. The contrast sensitivity of human colour vision to red-green and blue-yellow chromatic gratings. J Physiol (Lond) 1985;359:381–400. doi: 10.1113/jphysiol.1985.sp015591. [DOI] [PMC free article] [PubMed] [Google Scholar]
- 42.Peng Y-W, Blackstone CD, Huganir RL, Yau K-W. Distribution of glutamate receptor subtypes in the vertebrate retina. Neuroscience. 1995;66:483–497. doi: 10.1016/0306-4522(94)00569-q. [DOI] [PubMed] [Google Scholar]
- 43.Polyak SL. The retina. University of Chicago; Chicago: 1941. [Google Scholar]
- 44.Pugh EN, Jr, Larimer J. Test of the identity of the site of blue/yellow cancellation and the site of chromatic antagonism in the 1pathway. Vision Res. 1980;20:779–788. doi: 10.1016/0042-6989(80)90009-7. [DOI] [PubMed] [Google Scholar]
- 45.Qin P, Pourcho RG. Distribution of AMPA-selective glutamate receptor subunits in the cat retina. Brain Res. 1995;710:303–307. doi: 10.1016/0006-8993(95)01476-4. [DOI] [PubMed] [Google Scholar]
- 46.Rodieck RW. Which cells code for color? In: Valberg A, Lee B, editors. From pigments to perception. Plenum; New York: 1991. pp. 83–93. [Google Scholar]
- 47.Samy CN, Hirsch J. Comparison of human and monkey retinal photoreceptor sampling mosaics. Vis Neurosci. 1989;3:281–285. doi: 10.1017/s0952523800010038. [DOI] [PubMed] [Google Scholar]
- 48.Sekiguchi N, Williams DR, Brainard DH. Efficiency in detection of isoluminant and isochromatic interference fringes. J Opt Soc Am A. 1993;10:2118–2133. doi: 10.1364/josaa.10.002118. [DOI] [PubMed] [Google Scholar]
- 49.Smith RG. Montage: a system for three-dimensional reconstruction by personal computer. J Neurosci Methods. 1987;21:55–69. doi: 10.1016/0165-0270(87)90102-6. [DOI] [PubMed] [Google Scholar]
- 50.Stromeyer CF, Kranda K, Sternheim CE. Selective chromatic adaptation at different spatial frequencies. Vision Res. 1978;18:427–438. doi: 10.1016/0042-6989(78)90053-6. [DOI] [PubMed] [Google Scholar]
- 51.Tsukamoto Y, Smith RG, Sterling P. “Collective coding” of correlated cone signals in the retinal ganglion cell. Proc Natl Acad Sci USA. 1990;87:1860–1864. doi: 10.1073/pnas.87.5.1860. [DOI] [PMC free article] [PubMed] [Google Scholar]
- 52.Tsukamoto Y, Masarachia P, Schein SJ, Sterling P. Gap junctions between the pedicles of macaque foveal cones. Vision Res. 1992;32:1809–1815. doi: 10.1016/0042-6989(92)90042-h. [DOI] [PubMed] [Google Scholar]
- 53.Vardi N, Morigiwa K, Wang T-L, Shi Y-J, Sterling P (1998) Neurochemistry of the photoreceptor synaptic complex. Vision Res, in press. [DOI] [PubMed]
- 54.Wässle H, Grünert U, Röhrenbeck J, Boycott BB. Retinal ganglion cell density and cortical magnification factor in the primate. Vision Res. 1990;30:1897–1911. doi: 10.1016/0042-6989(90)90166-i. [DOI] [PubMed] [Google Scholar]
- 55.Wässle H, Grünert U, Martin PR, Boycott BB. Immunocytochemical characterization and spatial distribution of midget bipolar cells in the macaque monkey retina. Vision Res. 1994;34:561–579. doi: 10.1016/0042-6989(94)90013-2. [DOI] [PubMed] [Google Scholar]
- 56.Webster MA, Mollon JD. The influence of contrast adaptation on color appearance. Vision Res. 1994;34:1993–2020. doi: 10.1016/0042-6989(94)90028-0. [DOI] [PubMed] [Google Scholar]
- 57.Webster MA, Mollon JD. Adaptation and the color statistics of natural images. Vision Res. 1997;37:3283–3298. doi: 10.1016/s0042-6989(97)00125-9. [DOI] [PubMed] [Google Scholar]
- 58.Wiesel TN, Hubel DH. Spatial and chromatic interactions in the lateral geniculate body of the rhesus monkey. J Neurophysiol. 1966;29:1115–1156. doi: 10.1152/jn.1966.29.6.1115. [DOI] [PubMed] [Google Scholar]
- 59.Williams DR, MacLeod DIA, Hayhoe MM. Punctate sensitivity of the blue-sensitive mechanism. Vision Res. 1981;21:1357–1375. doi: 10.1016/0042-6989(81)90242-x. [DOI] [PubMed] [Google Scholar]
- 60.Williams RW, Collier RJ, Thompson BJ. Spatial resolution of the short wavelength mechanism. In: Mollon J, Sharpe L, editors. Colour vision: physiology and psychophysics. Academic; New York: 1983. pp. 487–503. [Google Scholar]
- 61.Williams RW, Sekiguchi N, Brainard D. Color, contrast sensitivity, and the cone mosaic. Proc Nat Acad Sci USA. 1993;90:9770–9777. doi: 10.1073/pnas.90.21.9770. [DOI] [PMC free article] [PubMed] [Google Scholar]
- 62.Wyszecki G, Stiles WS. Color science: concepts and methods, quantitative data and formulae. Ed 2. Wiley; New York: 1983. [Google Scholar]
- 63.Zhou ZJ, Marshak DW, Fain GL. Amino acid receptors of midget and parasol ganglion cells in primate retina. Proc Natl Acad Sci USA. 1994;91:4907–4911. doi: 10.1073/pnas.91.11.4907. [DOI] [PMC free article] [PubMed] [Google Scholar]
- 64.Zrenner E. Neurophysiological aspects of colour vision in primates. Comparative studies on simian retinal ganglion cells and the human visual system. Monograph. In: Braitenberg V, Barlow HB, Bullock TH, Florey E, Grüsser O-J, Peters A, editors. Studies of brain function, Vol 9. Springer; New York: 1983a. [Google Scholar]
- 65.Zrenner E. Neurophysiological aspects of colour vision mechanisms in the primate retina. In: Mollon J, Sharpe L, editors. Colour vision: physiology and psychophysics. Academic; New York: 1983b. pp. 211–223. [Google Scholar]


