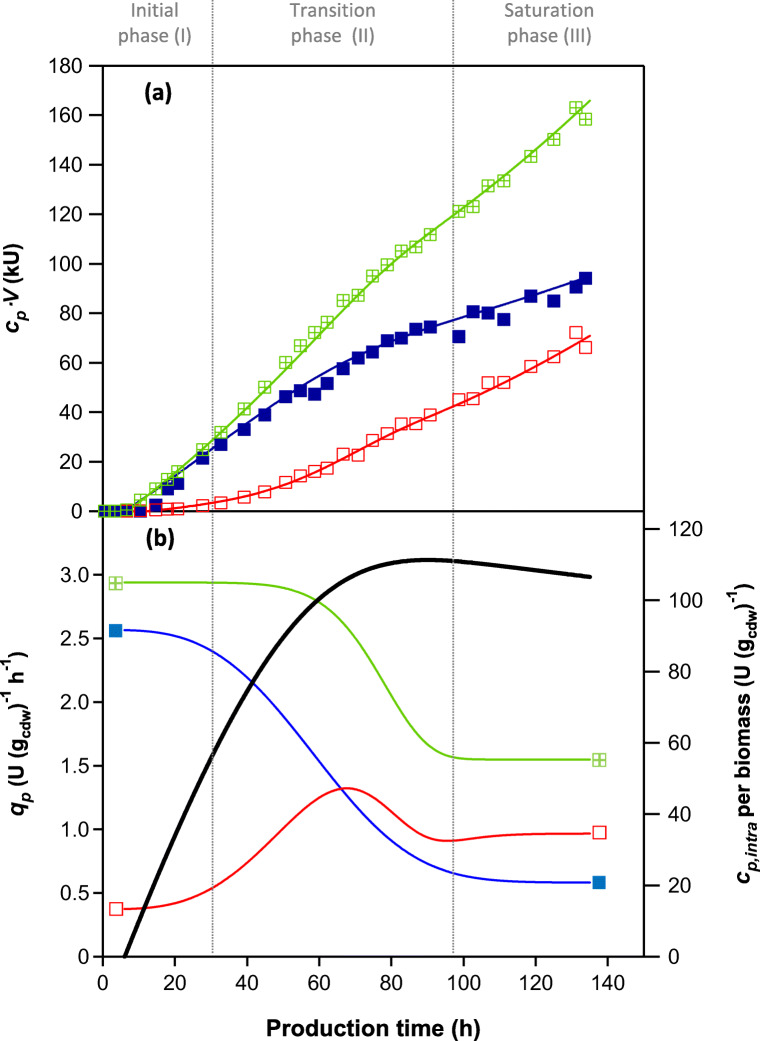
Fig. 3.
Time course of PGA production with distinguished phases with respect to qp. The displayed data were acquired in the cultivation ENS-C and represent the typically observed trend in PGA formation in all cultivations enlisted within this work. a Amount of PGA (in kU) during the production phase of cultivation. The symbols represent measured enzyme: crossed squares, total amount; full squares, intracellular amount; empty squares, extracellular amount. The solid lines represent the calculated theoretical values for the respective measured enzyme (kU). b The coloured lines marked by respective square symbols represent calculated qp(t) values: green (crossed squares)—qp,total, blue (full squares)—qp,intra, red (empty squares)—qp,extra (U (gcdw)−1 h−1). The black bold line represents the time development of intracellular PGA activity per gram cdw (U (gcdw)−1), which indicates the saturation of the cell with product. The time course of the specific production rate of PGA qp(t) was divided into three phases as indicated by the vertical dotted lines: initial, transition and saturation phase. Production time 0 indicates the time, from which methanol was fed

