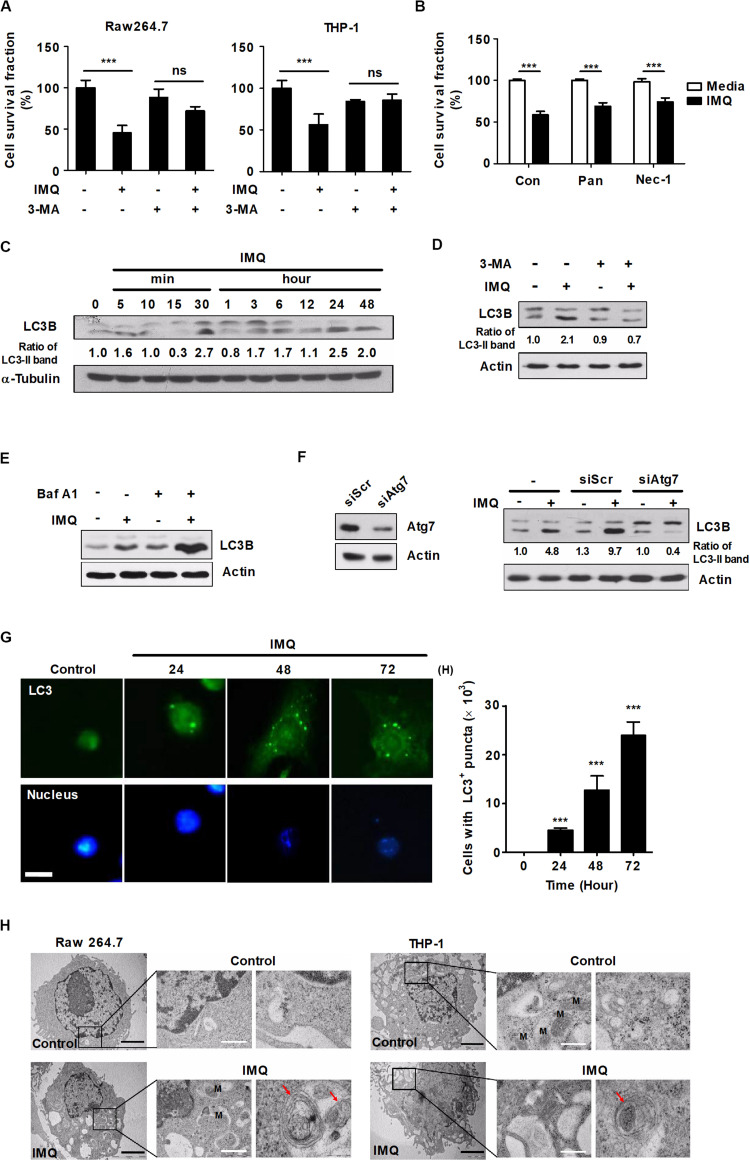
FIGURE 1.
IMQ induces autophagy in macrophages. (A) Raw264.7 or THP-1 cells were treated with IMQ (2 μg/mL) for 48 h in the presence or absence of 3-MA (10 mM for 2 h). (B) Raw264.7 cells were pretreated with necrostatin-1 (Nec-1; 50 μM for 1 h) or z-VAD-FMK (Pan; 10 μM for 2 h) and treated with IMQ. (A,B) Cell survival was assessed by WST-1 assays. (C,D) Western blots were performed with antibodies against LC3, α-tubulin or actin in Raw264.7 cells. (E) Raw264.7 cells were pretreated with bafilomycin A1 and then treated with IMQ. Protein levels of LC3B and actin were detected by a Western blot assay. (F) Raw264.7 cells were transfected with scrambled siRNA (siScr) or siRNA _targeting Atg7 and then treated with IMQ (2 μg/mL) for 48 h. Protein levels of LC3B, actin and Atg7 were detected by a Western blot assay. (G) Raw264.7 cells were incubated with IMQ (2 μg/mL) for the indicated times, and intracellular LC3 (green) was monitored. The nucleus was stained with DAPI (blue). Left panel: representative immunofluorescence images; scale bar 5 μm. Right panel: quantitative analysis of the percentages of cells with LC3+ puncta. (H) Multilayer membranes were observed by TEM. M, mitochondria, autophagic vacuoles; red arrows, black scale bar; 2 μm, white scale bar; 1 μm. (A–G) Data are the means ± s.d. of three technical replicates and are representative of at least three independent experiments. (H) Images are representative of at least three independent experiments. Statistical significance is indicated as ***p < 0.001 and ns, not significant (p > 0.05).

