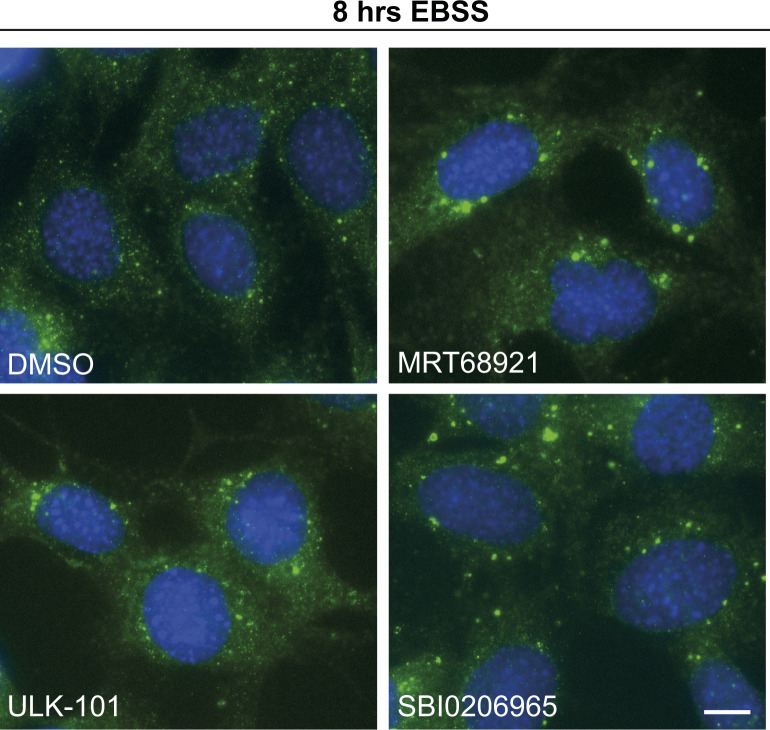
Figure S5. LC3 structures following autophagy induction and ULK1 inhibition.
MEF cells were co-treated with EBSS and either DMSO, 2 μM MRT68921, 1 μM ULK-101, or 5 μM SBI0206965 as indicated. Cells were subsequently fixed and stained for endogenous LC3 (green) and DAPI (blue) and imaged using a Nikon Eclipse Ti wide-field microscope. Scale bar, 10 μm.

