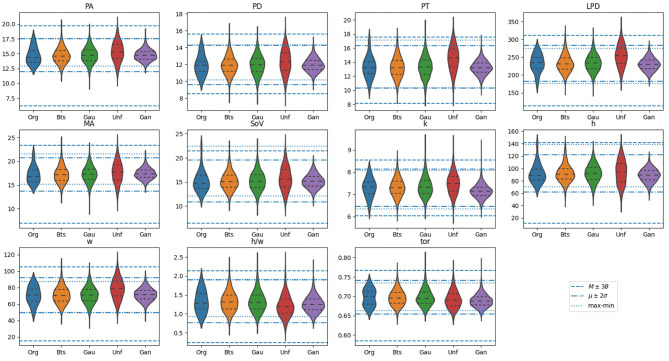
Figure 5.
Violin plots for the distribution of biomarkers on the original samples, alongside with those generated using the proposed methods: Bootstrap (Bts), Gaussian (Gau), Uniform (Unf) and generative adversarial network (GAN). Horizontal lines mark the bounds for the different acceptance criteria defined in section 2.5: , with dotted lines, , with dash-doted lines, and with dashed lines. The units of the vertical axis are in millimeters, except for biomarkers k, which is expressed in mm−1, and h/w and tor which are a dimensional.

