Abstract
Objective
The objective of this study was to investigate changes in volatile organic compounds (VOCs) in exhaled breath in overweight/ obese children compared to their lean counterparts.
Study Design
Single exhaled breath was collected and analyzed per protocol using selective ion flow tube mass spectrometry (SIFT-MS).
Results
60 overweight/ obese children and 55 lean controls were included. Compared to the lean group, the obese group was significantly older (14.1 ± 2.8 vs. 12.1 ± 3.0 years), taller (164.8 ± 10.9 vs. 153.3 ± 17.1 cm), and more likely to be Caucasian (60% vs. 35.2%); p < 0.05 for all. A comparison of the SIFT-MS results of the obese group to the lean group revealed differences in concentration of more than 50 compounds. A panel of four VOCs can identify the presence of overweight/ obesity with excellent accuracy. Further analysis revealed that breath isoprene, 1-decene, 1-octene, ammonia and hydrogen sulfide were significantly higher in the obese group compared to lean group (p value < 0.01 for all).
Conclusion
Obese children have a unique pattern of exhaled VOCs. Changes in VOCs observed in this study may help to gain insight into pathophysiological processes and pathways leading to the development of childhood obesity.
Keywords: Breath testing, biomarker, cholesterol synthesis, oxidative stress, insulin resistance, dyslipidemia
INTRODUCTION
Obesity has reached epidemic proportions in most of the western world. Data from the National Health and Nutrition Examination Survey (NHANES) collected in 2009–2010 showed that among children and adolescents aged 2 through 19 years, 31.8% were either overweight or obese, and 16.9% were obese (1). Obesity is associated with metabolic complications including insulin resistance, dyslipidemia and nonalcoholic fatty liver disease. However, mechanistic pathways that lead to obesity-induced metabolic perturbations are not clearly established (2). Understanding how metabolic profiles are altered in childhood obesity may provide valuable information on the pathogenesis of this epidemic and may be important for diagnosing complications and developing new therapeutic strategies.
The human body emits a wide array of volatile organic compounds (VOCs) in the breath that can be considered as the “breathprints” of each individual. Pathological conditions such as obesity can lead to the production of new VOCs or a change in the ratio of VOCs that are produced normally which may give insight into the metabolic condition of an individual. Little work has been done in children to assess the usefulness of these VOCs as biomarkers of disease states. Breath testing is becoming an increasingly important non-invasive diagnostic method that can be used in the evaluation of health and disease states (3, 4). More recent technological advancements in breath testing and analysis through gas and liquid chromatography and mass spectrometry have made it possible to identify thousands of substances and VOCs in the breath (4), offering great opportunities for investigating metabolic alterations in different disease states such as lung cancer, diabetes and liver disease (5–7). Breath testing enjoys major advantages in the pediatric population because it is noninvasive, safe, results can be available immediately, and serial measurements are easy to obtain.
The aims of this study were to assess 1) the feasibility of breath testing using selective ion flow tube mass spectrometry (SIFT- MS) in lean and obese children and 2) the ability to identify VOCs that correlate with childhood obesity.
METHODS
Overweight and obese children between the ages of 6 to 18 years old were recruited from the Pediatric Preventive Cardiology and Metabolic Clinic at the Cleveland Clinic. Healthy controls (6–18 years of age) were recruited from the General Pediatric Clinic during routine well-child visits. Demographic data were obtained, including age at the time of clinic visit, race and gender. Clinical variables were recorded, which included standard procedures for height and weight; the body mass index (BMI) was calculated for each patient (8). Overweight was defined by a BMI ≥ 85th percentile, obesity was defined by a BMI ≥ 95th percentile, and severe obesity was defined by a BMI ≥ 99th percentile adjusted for age and sex. The metabolic syndrome (MetS) in this cohort was defined as having three or more of the following five criteria (9): (1) abdominal obesity, defined as waist circumference (WC) ≥ 90th percentile for age and sex; (2) low HDL-cholesterol, defined as concentrations < 40 mg/dL; (3) hypertriglyceridemia, defined as triglyceride (TG) level > 110 mg/dL; (4) hypertension, defined as systolic or diastolic blood pressure >90th percentile; and (5) impaired fasting glucose (≥ 110 mg/dL) or known type 2 diabetes mellitus. The degree of insulin resistance (IR) was determined by the homeostatic model assessment (HOMA-IR) using the formula: insulin resistance = [fasting insulin (μU/mL) × fasting glucose (mg/dL)]/405. IR was defined as having HOMA-IR > 2.5. Adolescents with a history of alcohol consumption or smoking were excluded from the study.
Exhaled breath collection
All study subjects completed a mouth rinse with water prior to the collection of the breath sample in order to reduce the contamination from VOCs produced in the mouth. Subjects were prompted to exhale normally to release residual air from the lungs and then inhale to total lung capacity through a disposable mouth filter. The inhaled ambient air was also filtered through an attached N7500-2 acid gas cartridge. The filters were used to prevent viral and bacterial exposure to the subject and to eliminate exogenous VOCs from the inhaled air. The subjects then proceeded to exhale at a rate of 50 ml/s through the mouth filter until the lungs were emptied. The exhaled breath sample was collected into an attached Mylar® bag, capped, and analyzed within four hours. Mylar® bags were cleaned by flushing with nitrogen between subjects.
Selected-Ion Flow-Tube Mass Spectrometry (SIFT-MS)
The exhaled breath samples underwent gas analysis using SIFT-MS on a VOICE200® SIFT-MS instrument (Syft Technologies Ltd, Christchurch, New Zealand). The SIFT-MS technology and instrument used in this study have previously been described elsewhere by our group and others (10–12).
Mass scans of the product ions generated in the chemical ionization mass spectrum from each reagent ion (H3O+, NO+, and O2+) were obtained in the mass scanning (MS) mode. MS between 14–200 amu was used to identify significant peaks at product ion masses representing unknown breath volatiles relating to liver cirrhosis. More accurate concentration data was obtained by selected ion monitoring (SIM) of product ions of fourteen pre-selected compounds: 2-propanol, acetaldehyde, acetone, acrylonitrile, ammonia, benzene, carbon disulfide, dimethyl sulfide, ethanol, hydrogen sulfide, isoprene, pentane, triethylamine, and trimethylamine. These compounds have been previously identified as common constituents of exhaled breath in patients with and without liver cirrhosis (11).
Statistical Analysis
Data are presented as mean ± standard deviation, median [25th, 75th percentiles] or N (%). Univariable analysis was done to compare obese versus lean groups. Student’s t-tests or the non-parametric Wilcoxon rank sum tests were used to compare continuous variables and Pearson’s chi-square tests were used for categorical factors. In addition, analysis of covariance (ANCOVA) was used to assess differences while adjusting for possible confounders; the logarithm of each VOC was modeled as the outcome variables. A p < 0.05 was considered statistically significant. Classification was performed using canonical discriminant analysis of the mass scanning peaks. Following processing of the mass scanning peaks, forward stepwise variable selection was applied and four masses (variables) were selected. SAS (version 9.2, The SAS Institute, Cary, NC), JMP (Pro version 9.0, The SAS Institute, Cary, NC) and R (version 2.15.1, The R Foundation for Statistical Computing, Vienna, Austria) were used for all analyses.
RESULTS
Patient Characteristics
One hundred and fifteen patients were included in the study (60 obese patients and 55 lean controls). Children in the obese group were older, taller, and more likely to be Caucasian compared to those in the control group (14.1 ± 2.8 vs. 12.1 ± 3.0 years; 164.8 ± 10.9 vs. 153.3 ± 17.1 cm; and 60% vs. 35% Caucasian; p < 0.05 for all) (Table 1). Thirty one children in the obese group were severely obese with BMI ≥ 99th percentile for age and sex. MetS was present in 39/60 (65%) in the obese group.
Table 1.
Demographic Characteristics of the Study Population
| Factor | Control (N=55) | Obese (N=60) | p-value |
|---|---|---|---|
| Age (years) | 12.1±3.0 | 14.1±2.8 | <0.001 |
| Male | 35(63.6) | 33(55) | 0.28 |
| Height (cm) | 153.3±17.1 | 164.8±10.9 | <0.001 |
| BMI percentile | 55.8±24.6 | 96.3±3.6 | <0.001 |
| Caucasian (%) | 19(35.2) | 36(60.0) | 0.008 |
| Race (%) | 0.031 | ||
| White | 19(35.2) | 36(60.0) | |
| Black | 23(42.6) | 14(23.3) | |
| Hispanic | 4(7.4) | 6(10.0) | |
| Other | 8(14.8) | 4(6.7) |
Values presented as Mean ± SD with t-test or N (%) with Pearson’s chi-square test.
Categorization of Obesity Status Using Unique Metabolomic Breathprint
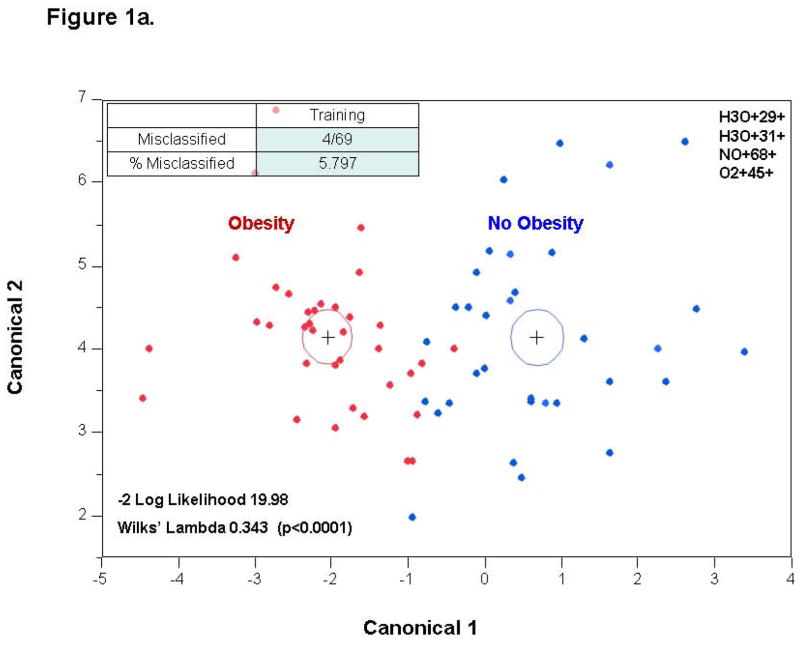
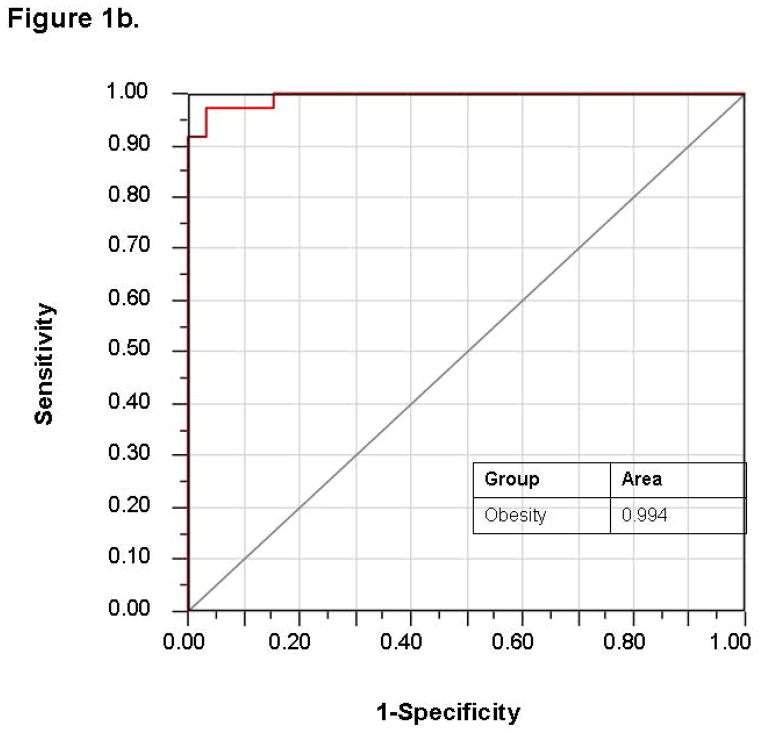
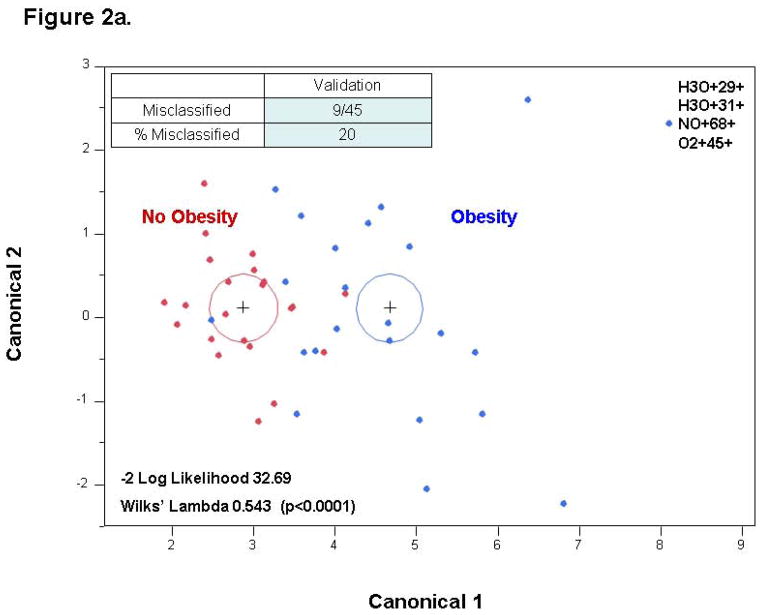
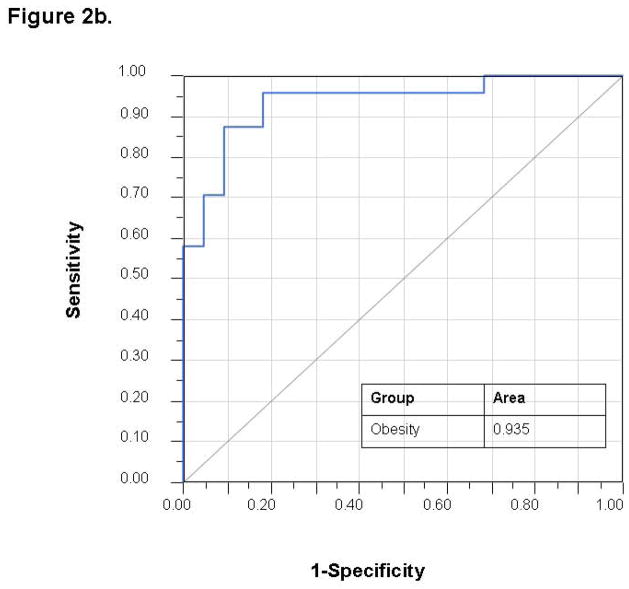
Stepwise variable selection was performed using the mass scanning ion peak data. Four ion peaks were used to classify subjects into those with and without obesity with 4 patients that were misclassified in a 69 patient training set (−2 log likelihood 19.98; Wilks’ Lambda 0.343 (p < 0.0001)) (Figure 1a). The use of these four ion peaks gave an excellent accuracy for predicting the presence of obesity with an AUC of 0.994 (Figure 1b). The discriminant analysis model was then successfully tested in an independent 45 patient validation cohort with 9 misclassifications and an AUC of 0.935 (Figure 2). A sample profile is shown below for the NO+68+ peak (in red, figure 4), which we were able to identify as isoprene.
Figure 1. Training Set.
1a. Canonical discriminant analysis using the identified four ion peaks: obese vs. lean subjects. Given two groups of observations (obese and lean) with measurements on several variables (VOCs), canonical discriminant analysis derives a linear combination of the variables that has the highest possible multiple correlation with the groups. The red dots represent obese children and the blue dots represent lean controls. 1b. ROC curve demonstrating excellent accuracy for predicting obesity with AUC of 0.994.
Figure 2. Validation Set.
The same VOCs used in the training set can discriminate between obese and lean children with AUC of 0.935.
Figure 4. Mass spectrometry peak of isoprene showing significant elevation in the obese group.
A sample profile of mass scanning is shown for the NO+68+ peak (in red), which corresponds to the volatile organic compound of isoprene.
VOC Changes in Children with Obesity
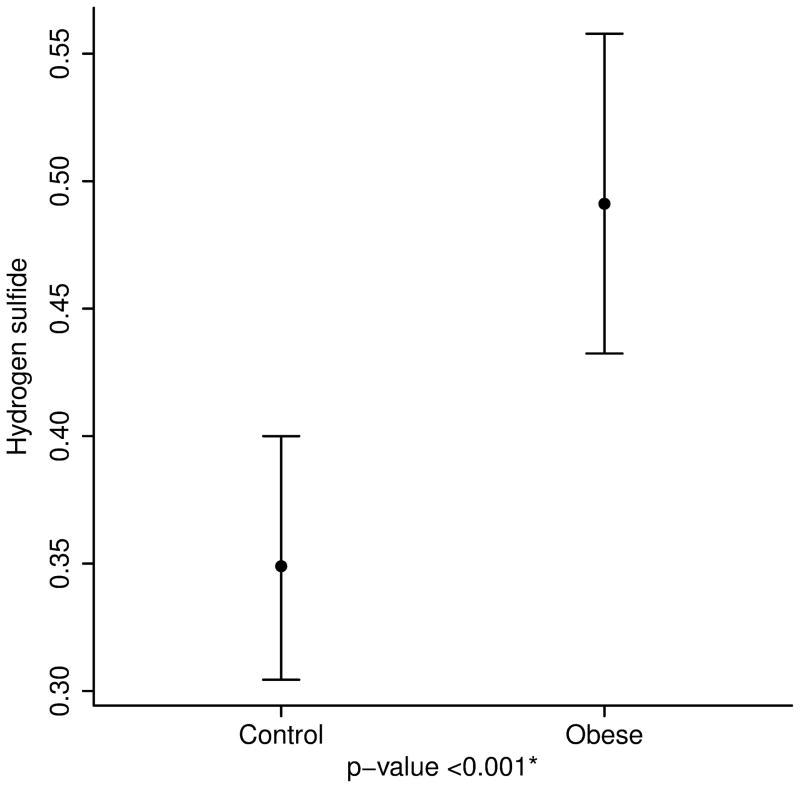
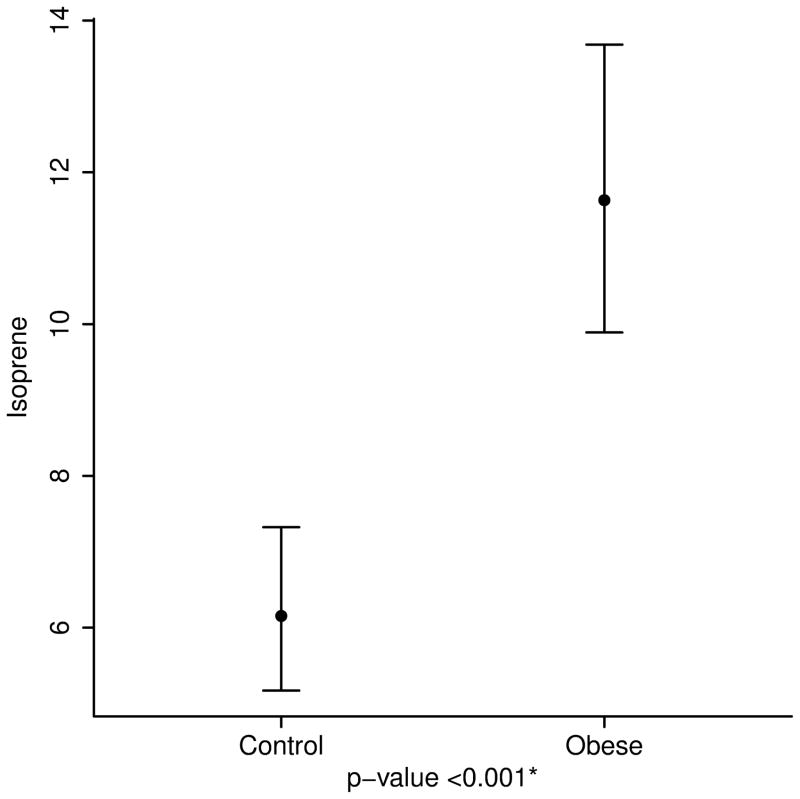
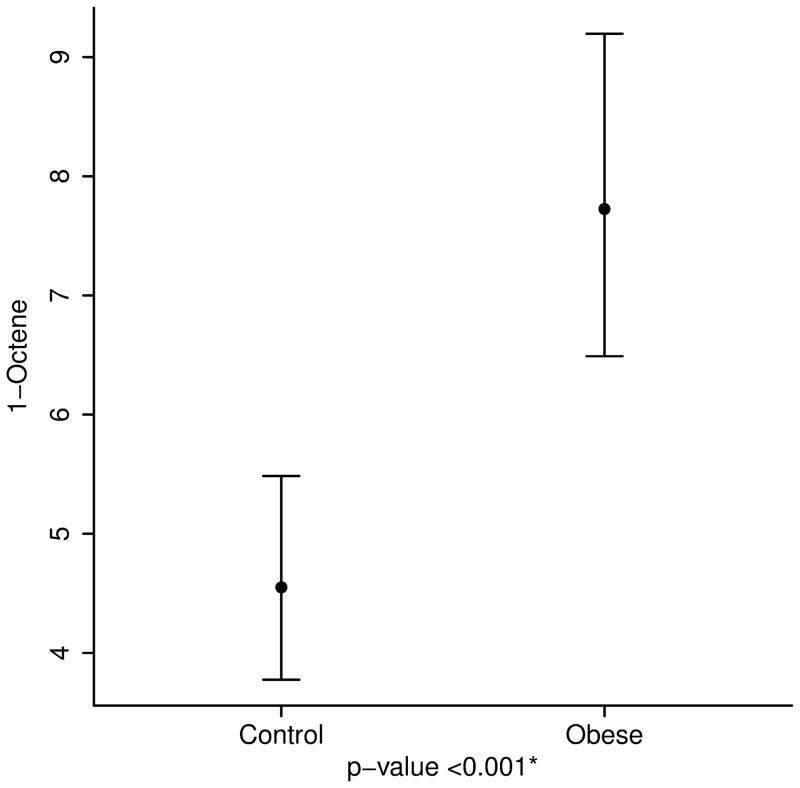
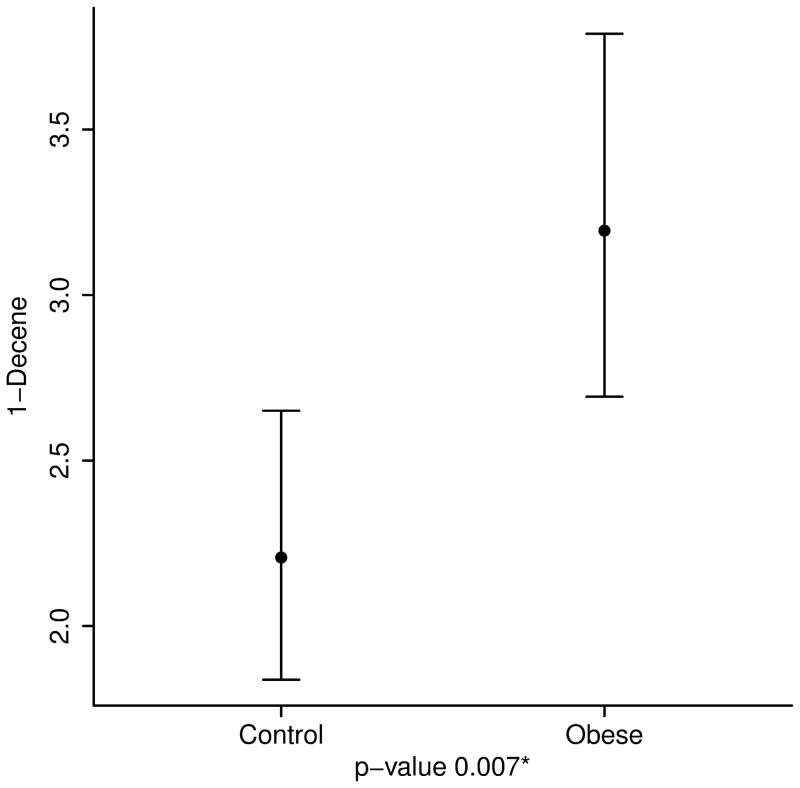
After adjusting for age, height and race, the concentrations of breath isoprene, 1-decene, 1-octene, ammonia, and hydrogen sulfide were significantly higher in the obese group compared to the lean group (11.6 ppb vs. 6.2 for isoprene; 3.2 vs. 2.2 for 1-decene; 7.7 vs. 4.6 for 1-octene; 67.4 vs. 50.1 for ammonia; and 0.49 vs. 0.35 for hydrogen sulfide, p value < 0.01 for all) (Table 2 and Figure 3). Interestingly, within the obese group, levels of acetone and isoprene were higher in those with IR (HOMA-IR > 2.5) (14.8 ppb vs. 9.6 for isoprene and 64.2 vs. 46.4 for acetone, p value < 0.05 for both). No differences in the concentration of VOCs were noted between severely obese (BMI ≥ 99th percentile) and overweight/ obese children (85th ≤ BMI < 99th percentile) (Supplementary Table).
Table 2.
Mean Volatile Organic Compound Levels Adjusted For Age, Height and Race
| Factor | Control (N=55) | Obese (N=60) | p-value |
|---|---|---|---|
| Acetaldehyde | 29.3 (25.5, 33.7) | 29.4 (25.8, 33.5) | 0.98 |
| Acetone | 55.6 (44.7, 69.0) | 51.5 (42.0, 63.0) | 0.63 |
| Isoprene | 6.2 (5.2, 7.3) | 11.6 (9.9, 13.7) | <0.001 |
| 1-Decene | 2.2 (1.8, 2.7) | 3.2 (2.7, 3.8) | 0.007 |
| 1-Octene | 4.6 (3.8, 5.5) | 7.7 (6.5, 9.2) | <0.001 |
| Ammonia | 50.1 (44.1, 56.9) | 67.4 (59.8, 75.9) | 0.002 |
| Hydrogen sulfide | 0.35 (0.30, 0.40) | 0.49 (0.43, 0.56) | <0.001 |
Values presented as Mean (95% CL) and were obtained using ANCOVA analysis. The logarithm of each VOC was modeled as the outcome variable with obesity, age, height and Caucasian as the independent variables.
Figure 3. Volatile Organic Compound Levels in Obese and Lean Children.
3a. Isoprene, a marker of cholesterol synthesis is markedly elevated in obese children. 3b and 3c. 1-Octene and 1-Decene, markers of increased oxidative stress are higher in obese children. 3d and 3e. Ammonia and hydrogen sulfide, markers of liver disease are elevated in childhood obesity.
DISCUSSION
The principal findings of this study relate to the following: 1) Obese children have a unique pattern of VOCs compared to lean children, 2) Markers of cholesterol synthesis, oxidative stress, and liver dysfunction are elevated in obese children, 3) Breath testing is feasible in lean, overweight and obese children as young as 7 years of age.
Breath testing with SIFT-MS emerged recently as a new technology for detection of breath gases in humans with several important benefits over other types of mass spectrometers (13). It has the advantage of performing measurements of complex mixtures regardless of the water vapor content in real time. Another great advantage of SIFT-MS is its ability to detect down to very low concentrations for many VOCs. Concentrations as low as parts per trillion (ppt) are common for several VOCs (14). In addition to this, the use of three precursor ions (H3O+, NO+, O2+) that react with the breath sample allows for isomeric compounds to be distinguished from each other based on their unique reaction products with these precursors. Therefore, this technology can yield a wealth of information for investigating the pathogenesis of childhood obesity.
Our study demonstrated that there are various VOCs detectable in the breath that could potentially be useful in understanding the pathogenesis of childhood obesity and its related complications. Isoprene is a by-product of cholesterol biosynthesis which may be upregulated in obese patients (15). Indeed, recent studies have demonstrated that cholesterol metabolism in obese adults with fatty liver disease characterized by increased synthesis and decreased absorption (16). Furthermore, data suggest that the gut microbiota may produce isoprene (17). Sulfur-containing compounds and ammonia levels are known to be elevated in patients with liver dysfunction (18). Fatty liver disease is very common in obese children and adolescents reaching a prevalence of 40–50% (19, 20) which may partly explain the changes in hydrogen sulfide and ammonia. Hydrocarbons such as 1-octene and 1-decene are considered markers of oxidative stress (14, 21) and a recent study has identified 1-octene as a potential marker for malignant lung nodules (22). Oxidative stress has been recognized to play a key role in the clinical course of obesity (23).
Our study has several limitations including the fact that our obese children were seen at a large referral tertiary care medical center, and a significant percentage had severe obesity. These findings therefore may not be applicable to overweight pediatric patients in the community. Due to the fact that we only had 5 children who were overweight (BMI between 85–94%) and more than 50% of children in the obese group were severely obese (BMI ≥ 99%), we were not able to demonstrated a dose response curve of each metabolite as a function of BMI. The association between certain VOCs and obesity should be interpreted with caution and future studies that include a larger number of overweight children will help to prove the dependence of VOCs on the severity of obesity as assessed by BMI. We were not able to control factors that may influence VOC concentrations such as diet, medications and the time of day the breath samples are obtained. Including a control group with no need to be fasting for routine laboratory values made it more difficult for us to control for diet and time of the day. Some children were only able to provide samples after the school day. This study was cross-sectional and the VOCs were determined at a single time point. Performing breath testing serially on children in both health and disease may help us better understand the effects of changes in VOCs on different biological processes and their potential impact on disease development and progression. Finally, the use of a filter during breath sample collection to eliminate exogenous VOCs from the inhaled air may have affected the measurement of endogenous VOCs. However, preliminary data from our laboratory on healthy volunteers have demonstrated negligible effects of having the filter on endogenous VOC peaks (unpublished data).
The results of the current study suggest that cholesterol synthesis, oxidative stress, and liver function are altered in childhood obesity. Uncovering novel metabolic processes that play a role in disease development would both improve identification of subjects at greatest risk for complication and help the discovery of new mechanism-based interventions for the treatment and prevention of pediatric obesity. BT is a simple and safe alternative to more invasive investigations in children. This study opens the door for future studies assessing the role of single exhaled breath testing in screening for obesity-related comorbidities such as type 2 diabetes, metabolic syndrome and fatty liver disease.
In conclusion, our data provide evidence on significant changes of VOCs in childhood obesity. Breath testing is a promising tool to investigate pathophysiological mechanisms that are altered in overweight and obese children.
Supplementary Material
What is already known about this subject?
Childhood obesity has reached epidemic proportions in the United States.
Obesity is associated with metabolic complications in children including insulin resistance, dyslipidemia and nonalcoholic fatty liver disease.
Breath testing is becoming an increasingly important non-invasive diagnostic method.
What does this study add?
Obese children have a unique pattern of volatile organic compounds (VOCs) in exhaled breath compared to lean children.
Markers of cholesterol synthesis, oxidative stress, and liver dysfunction are elevated in obese children.
Levels of acetone and isoprene in the breath are higher in obese children with insulin resistance.
Acknowledgments
Funding: This work was supported by the BRCP 08-049 Third Frontier Program grant from the Ohio Department of Development. Dr Dweik is also supported by the following grants: HL107147, HL081064, HL103453, HL109250, and RR026231 from the National Institutes of Health (NIH).
Footnotes
Conflict of Interest: No conflict of interest exists for any of the authors.
Author Contributions:
NA: Study concept and design; acquisition of data; analysis and interpretation of data; drafting of the manuscript; critical revision of the manuscript for important intellectual content.
KE: Acquisition of data; analysis and interpretation of data; critical revision of the manuscript for important intellectual content.
FC: Acquisition of data; analysis and interpretation of data; critical revision of the manuscript for important intellectual content.
CY: Acquisition of data; analysis and interpretation of data; critical revision of the manuscript for important intellectual content.
AB: Analysis and interpretation of data; critical revision of the manuscript for important intellectual content.
ER: Analysis and interpretation of data; critical revision of the manuscript for important intellectual content.
IH: Analysis and interpretation of data; critical revision of the manuscript for important intellectual content.
DG: Acquisition of data; analysis and interpretation of data.?
RL: Statistical analysis; analysis and interpretation of data; critical revision of the manuscript for important intellectual content.
SLH: Study concept and design; analysis and interpretation of data; critical revision of the manuscript for important intellectual content;
RD: Study concept and design; analysis and interpretation of data; critical revision of the manuscript for important intellectual content; obtained funding.
References
- 1.Ogden CL, Carroll MD, Kit BK, Flegal KM. Prevalence of obesity and trends in body mass index among US children and adolescents, 1999–2010. Jama. 2012;307:483–490. doi: 10.1001/jama.2012.40. [DOI] [PMC free article] [PubMed] [Google Scholar]
- 2.Kim JY, Park JY, Kim OY, Ham BM, Kim HJ, Kwon DY, Jang Y, et al. Metabolic profiling of plasma in overweight/obese and lean men using ultra performance liquid chromatography and Q-TOF mass spectrometry (UPLC-Q-TOF MS) J Proteome Res. 2010;9:4368–4375. doi: 10.1021/pr100101p. [DOI] [PubMed] [Google Scholar]
- 3.Mashir A, Dweik RA. Exhaled breath analysis: The new interface between medicine and engineering. Adv Powder Technol. 2009;20:420–425. doi: 10.1016/j.apt.2009.05.003. [DOI] [PMC free article] [PubMed] [Google Scholar]
- 4.Paschke KM, Mashir A, Dweik RA. Clinical applications of breath testing. F1000 Med Rep. 2010;2:56. doi: 10.3410/M2-56. [DOI] [PMC free article] [PubMed] [Google Scholar]
- 5.Minh TD, Oliver SR, Ngo J, Flores R, Midyett J, Meinardi S, Carlson MK, et al. Noninvasive measurement of plasma glucose from exhaled breath in healthy and type 1 diabetic subjects. Am J Physiol Endocrinol Metab. 2011;300:E1166–1175. doi: 10.1152/ajpendo.00634.2010. [DOI] [PMC free article] [PubMed] [Google Scholar]
- 6.Phillips M, Gleeson K, Hughes JM, Greenberg J, Cataneo RN, Baker L, McVay WP. Volatile organic compounds in breath as markers of lung cancer: a cross-sectional study. Lancet. 1999;353:1930–1933. doi: 10.1016/S0140-6736(98)07552-7. [DOI] [PubMed] [Google Scholar]
- 7.Sehnert SS, Jiang L, Burdick JF, Risby TH. Breath biomarkers for detection of human liver diseases: preliminary study. Biomarkers. 2002;7:174–187. doi: 10.1080/13547500110118184. [DOI] [PubMed] [Google Scholar]
- 8.Kuczmarski RJ, Ogden CL, Grummer-Strawn LM, Flegal KM, Guo SS, Wei R, Mei Z, et al. CDC growth charts: United States. Adv Data. 2000;314:1–27. [PubMed] [Google Scholar]
- 9.Ford ES, Ajani UA, Mokdad AH. The metabolic syndrome and concentrations of C-reactive protein among U.S. youth. Diabetes Care. 2005;28:878–881. doi: 10.2337/diacare.28.4.878. [DOI] [PubMed] [Google Scholar]
- 10.Mashir A, Paschke KM, van Duin D, Shrestha NK, Laskowski D, Storer MK, Yen-Lieberman B, et al. Effect of the influenza A (H1N1) live attenuated intranasal vaccine on nitric oxide (FE(NO)) and other volatiles in exhaled breath. J Breath Res. 2011;5:037107. doi: 10.1088/1752-7155/5/3/037107. [DOI] [PMC free article] [PubMed] [Google Scholar]
- 11.Prince BJ, Milligan DB, McEwan MJ. Application of selected ion flow tube mass spectrometry to real-time atmospheric monitoring. Rapid Commun Mass Spectrom. 2010;24:1763–1769. doi: 10.1002/rcm.4574. [DOI] [PubMed] [Google Scholar]
- 12.Smith D, Spanel P. Selected ion flow tube mass spectrometry (SIFT-MS) for online trace gas analysis. Mass Spectrom Rev. 2005;24:661–700. doi: 10.1002/mas.20033. [DOI] [PubMed] [Google Scholar]
- 13.Wilson HK, Monster AC. New technologies in the use of exhaled breath analysis for biological monitoring. Occup Environ Med. 1999;56:753–757. doi: 10.1136/oem.56.11.753. [DOI] [PMC free article] [PubMed] [Google Scholar]
- 14.Buszewski B, Kesy M, Ligor T, Amann A. Human exhaled air analytics: biomarkers of diseases. Biomed Chromatogr. 2007;21:553–566. doi: 10.1002/bmc.835. [DOI] [PubMed] [Google Scholar]
- 15.Kushch I, Arendacka B, Stolc S, Mochalski P, Filipiak W, Schwarz K, Schwentner L, et al. Breath isoprene--aspects of normal physiology related to age, gender and cholesterol profile as determined in a proton transfer reaction mass spectrometry study. Clin Chem Lab Med. 2008;46:1011–1018. doi: 10.1515/CCLM.2008.181. [DOI] [PubMed] [Google Scholar]
- 16.Simonen P, Kotronen A, Hallikainen M, Sevastianova K, Makkonen J, Hakkarainen A, Lundbom N, et al. Cholesterol synthesis is increased and absorption decreased in non-alcoholic fatty liver disease independent of obesity. J Hepatol. 2011;54:153–159. doi: 10.1016/j.jhep.2010.05.037. [DOI] [PubMed] [Google Scholar]
- 17.Salerno-Kennedy R, Cashman KD. Potential applications of breath isoprene as a biomarker in modern medicine: a concise overview. Wien Klin Wochenschr. 2005;117:180–186. doi: 10.1007/s00508-005-0336-9. [DOI] [PubMed] [Google Scholar]
- 18.Miekisch W, Schubert JK, Noeldge-Schomburg GF. Diagnostic potential of breath analysis--focus on volatile organic compounds. Clin Chim Acta. 2004;347:25–39. doi: 10.1016/j.cccn.2004.04.023. [DOI] [PubMed] [Google Scholar]
- 19.Franzese A, Vajro P, Argenziano A, Puzziello A, Iannucci MP, Saviano MC, Brunetti F, et al. Liver involvement in obese children. Ultrasonography and liver enzyme levels at diagnosis and during follow-up in an Italian population. Dig Dis Sci. 1997;42:1428–1432. doi: 10.1023/a:1018850223495. [DOI] [PubMed] [Google Scholar]
- 20.Schwimmer JB, Deutsch R, Kahen T, Lavine JE, Stanley C, Behling C. Prevalence of fatty liver in children and adolescents. Pediatrics. 2006;118:1388–1393. doi: 10.1542/peds.2006-1212. [DOI] [PubMed] [Google Scholar]
- 21.Cikach FS, Jr, Dweik RA. Cardiovascular biomarkers in exhaled breath. Prog Cardiovasc Dis. 2012;55:34–43. doi: 10.1016/j.pcad.2012.05.005. [DOI] [PMC free article] [PubMed] [Google Scholar]
- 22.Peled N, Hakim M, Bunn PA, Jr, Miller YE, Kennedy TC, Mattei J, Mitchell JD, et al. Non-invasive breath analysis of pulmonary nodules. J Thorac Oncol. 2012;7:1528–1533. doi: 10.1097/JTO.0b013e3182637d5f. [DOI] [PMC free article] [PubMed] [Google Scholar]
- 23.Bondia-Pons I, Ryan L, Martinez JA. Oxidative stress and inflammation interactions in human obesity. J Physiol Biochem. 2012;68:701–711. doi: 10.1007/s13105-012-0154-2. [DOI] [PubMed] [Google Scholar]
Associated Data
This section collects any data citations, data availability statements, or supplementary materials included in this article.


