A simple model for calculating the kinetics of protein folding from three-dimensional structures
- PMID: 10500173
- PMCID: PMC18030
- DOI: 10.1073/pnas.96.20.11311
A simple model for calculating the kinetics of protein folding from three-dimensional structures
Abstract
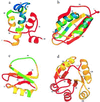
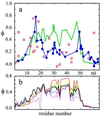
An elementary statistical mechanical model was used to calculate the folding rates for 22 proteins from their known three-dimensional structures. In this model, residues come into contact only after all of the intervening chain is in the native conformation. An additional simplifying assumption is that native structure grows from localized regions that then fuse to form the complete native molecule. The free energy function for this model contains just two contributions-conformational entropy of the backbone and the energy of the inter-residue contacts. The matrix of inter-residue interactions is obtained from the atomic coordinates of the three-dimensional structure. For the 18 proteins that exhibit two-state equilibrium and kinetic behavior, profiles of the free energy versus the number of native peptide bonds show two deep minima, corresponding to the native and denatured states. For four proteins known to exhibit intermediates in folding, the free energy profiles show additional deep minima. The calculated rates of folding the two-state proteins, obtained by solving a diffusion equation for motion on the free energy profiles, reproduce the experimentally determined values surprisingly well. The success of these calculations suggests that folding speed is largely determined by the distribution and strength of contacts in the native structure. We also calculated the effect of mutations on the folding kinetics of chymotrypsin inhibitor 2, the most intensively studied two-state protein, with some success.
Figures


Comment in
-
Go-ing for the prediction of protein folding mechanisms.Proc Natl Acad Sci U S A. 1999 Oct 12;96(21):11698-700. doi: 10.1073/pnas.96.21.11698. Proc Natl Acad Sci U S A. 1999. PMID: 10518512 Free PMC article. Review. No abstract available.
Similar articles
-
Factors governing the foldability of proteins.Proteins. 1996 Dec;26(4):411-41. doi: 10.1002/(SICI)1097-0134(199612)26:4<411::AID-PROT4>3.0.CO;2-E. Proteins. 1996. PMID: 8990496
-
The nature of the free energy barriers to two-state folding.Proteins. 2004 Oct 1;57(1):142-52. doi: 10.1002/prot.20172. Proteins. 2004. PMID: 15326600
-
Statistical mechanics of protein folding, unfolding and fluctuation.Adv Biophys. 1976:65-113. Adv Biophys. 1976. PMID: 1015397
-
The folding energy landscape and free energy excitations of cytochrome c.Acc Chem Res. 2010 May 18;43(5):652-60. doi: 10.1021/ar9002703. Acc Chem Res. 2010. PMID: 20143816 Free PMC article. Review.
-
Understanding the folding rates and folding nuclei of globular proteins.Curr Protein Pept Sci. 2007 Dec;8(6):521-36. doi: 10.2174/138920307783018695. Curr Protein Pept Sci. 2007. PMID: 18220841 Review.
Cited by
-
Folding kinetics of an entangled protein.PLoS Comput Biol. 2023 Nov 13;19(11):e1011107. doi: 10.1371/journal.pcbi.1011107. eCollection 2023 Nov. PLoS Comput Biol. 2023. PMID: 37956216 Free PMC article.
-
A Perspective on Interdicting in Protein Misfolding for Therapeutic Drug Design: Modulating the Formation of Nonlocal Contacts in α-Synuclein as a Strategy against Parkinson's Disease.J Phys Chem B. 2024 Jul 11;128(27):6439-6448. doi: 10.1021/acs.jpcb.3c07519. Epub 2024 Jun 28. J Phys Chem B. 2024. PMID: 38940731 Free PMC article. Review.
-
Helix-coil transition in terms of Potts-like spins.Eur Phys J E Soft Matter. 2013 May;36(5):46. doi: 10.1140/epje/i2013-13046-7. Epub 2013 May 14. Eur Phys J E Soft Matter. 2013. PMID: 23665762
-
Cooperativity in two-state protein folding kinetics.Protein Sci. 2004 Mar;13(3):822-9. doi: 10.1110/ps.03403604. Protein Sci. 2004. PMID: 14978313 Free PMC article.
-
Effects of disulfide bonds on folding behavior and mechanism of the beta-sheet protein tendamistat.Biophys J. 2006 Jan 1;90(1):272-86. doi: 10.1529/biophysj.105.063552. Epub 2005 Oct 7. Biophys J. 2006. PMID: 16214873 Free PMC article.
References
MeSH terms
LinkOut - more resources
Full Text Sources
Other Literature Sources

