Genome-wide expression analysis reveals dysregulation of myelination-related genes in chronic schizophrenia
- PMID: 11296301
- PMCID: PMC31905
- DOI: 10.1073/pnas.081071198
Genome-wide expression analysis reveals dysregulation of myelination-related genes in chronic schizophrenia
Abstract
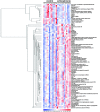
Neuropathological and brain imaging studies suggest that schizophrenia may result from neurodevelopmental defects. Cytoarchitectural studies indicate cellular abnormalities suggestive of a disruption in neuronal connectivity in schizophrenia, particularly in the dorsolateral prefrontal cortex. Yet, the molecular mechanisms underlying these findings remain unclear. To identify molecular substrates associated with schizophrenia, DNA microarray analysis was used to assay gene expression levels in postmortem dorsolateral prefrontal cortex of schizophrenic and control patients. Genes determined to have altered expression levels in schizophrenics relative to controls are involved in a number of biological processes, including synaptic plasticity, neuronal development, neurotransmission, and signal transduction. Most notable was the differential expression of myelination-related genes suggesting a disruption in oligodendrocyte function in schizophrenia.
Figures


Similar articles
-
Oligodendrocyte dysfunction in schizophrenia and bipolar disorder.Lancet. 2003 Sep 6;362(9386):798-805. doi: 10.1016/S0140-6736(03)14289-4. Lancet. 2003. PMID: 13678875
-
Variations in oligodendrocyte-related gene expression across multiple cortical regions: implications for the pathophysiology of schizophrenia.Int J Neuropsychopharmacol. 2007 Aug;10(4):565-73. doi: 10.1017/S1461145706007310. Epub 2007 Feb 12. Int J Neuropsychopharmacol. 2007. PMID: 17291370
-
Dysregulation of myelination-related genes in schizophrenia.J Neurochem. 2024 Sep;168(9):2227-2242. doi: 10.1111/jnc.16152. Epub 2024 Jul 31. J Neurochem. 2024. PMID: 39086020 Review.
-
Introduction to the special section: Myelin and oligodendrocyte abnormalities in schizophrenia.Int J Neuropsychopharmacol. 2007 Aug;10(4):499-502. doi: 10.1017/S1461145706007449. Int J Neuropsychopharmacol. 2007. PMID: 17583597
-
Epigenetic and post-transcriptional dysregulation of gene expression in schizophrenia and related disease.Neurobiol Dis. 2012 May;46(2):255-62. doi: 10.1016/j.nbd.2011.12.008. Epub 2011 Dec 13. Neurobiol Dis. 2012. PMID: 22182689 Review.
Cited by
-
Antipsychotic drugs counteract autophagy and mitophagy in multiple sclerosis.Proc Natl Acad Sci U S A. 2021 Jun 15;118(24):e2020078118. doi: 10.1073/pnas.2020078118. Proc Natl Acad Sci U S A. 2021. PMID: 34099564 Free PMC article.
-
Altered prefrontal cortical MARCKS and PPP1R9A mRNA expression in schizophrenia and bipolar disorder.Schizophr Res. 2015 May;164(1-3):100-8. doi: 10.1016/j.schres.2015.02.005. Epub 2015 Mar 7. Schizophr Res. 2015. PMID: 25757715 Free PMC article.
-
Cholinergic connectivity: it's implications for psychiatric disorders.Front Cell Neurosci. 2013 May 3;7:55. doi: 10.3389/fncel.2013.00055. eCollection 2013. Front Cell Neurosci. 2013. PMID: 23653591 Free PMC article.
-
Quetiapine Ameliorates Schizophrenia-Like Behaviors and Protects Myelin Integrity in Cuprizone Intoxicated Mice: The Involvement of Notch Signaling Pathway.Int J Neuropsychopharmacol. 2015 Aug 1;19(2):pyv088. doi: 10.1093/ijnp/pyv088. Int J Neuropsychopharmacol. 2015. PMID: 26232790 Free PMC article.
-
Impact on intracortical myelination trajectory of long acting injection versus oral risperidone in first-episode schizophrenia.Schizophr Res. 2012 Sep;140(1-3):122-8. doi: 10.1016/j.schres.2012.06.036. Epub 2012 Jul 17. Schizophr Res. 2012. PMID: 22809684 Free PMC article. Clinical Trial.
References
-
- Arnold S E, Trojanowski J Q. Acta Neuropathol (Berl) 1996;92:217–231. - PubMed
-
- Harrison P J. Brain. 1999;122:593–624. - PubMed
-
- Benes F M. Brain Res Brain Res Rev. 2000;31:251–269. - PubMed
-
- Owen M J. Brain Res Brain Res Rev. 2000;31:179–186. - PubMed
-
- Lipshutz R J, Fodor S P, Gingeras T R, Lockhart D J. Nat Genet. 1999;21:20–24. - PubMed
Publication types
MeSH terms
Grants and funding
LinkOut - more resources
Full Text Sources
Other Literature Sources
Medical

