The Runx3 transcription factor regulates development and survival of TrkC dorsal root ganglia neurons
- PMID: 12093746
- PMCID: PMC125397
- DOI: 10.1093/emboj/cdf370
The Runx3 transcription factor regulates development and survival of TrkC dorsal root ganglia neurons
Abstract
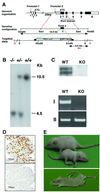
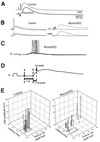
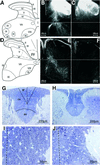
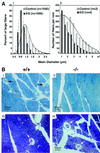
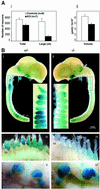
The RUNX transcription factors are important regulators of linage-specific gene expression in major developmental pathways. Recently, we demonstrated that Runx3 is highly expressed in developing cranial and dorsal root ganglia (DRGs). Here we report that within the DRGs, Runx3 is specifically expressed in a subset of neurons, the tyrosine kinase receptor C (TrkC) proprioceptive neurons. We show that Runx3-deficient mice develop severe limb ataxia due to disruption of monosynaptic connectivity between intra spinal afferents and motoneurons. We demonstrate that the underlying cause of the defect is a loss of DRG proprioceptive neurons, reflected by a decreased number of TrkC-, parvalbumin- and beta-galactosidase-positive cells. Thus, Runx3 is a neurogenic TrkC neuron-specific transcription factor. In its absence, TrkC neurons in the DRG do not survive long enough to extend their axons toward _target cells, resulting in lack of connectivity and ataxia. The data provide new genetic insights into the neurogenesis of DRGs and may help elucidate the molecular mechanisms underlying somatosensory-related ataxia in humans.
Figures


Similar articles
-
Dynamic regulation of the expression of neurotrophin receptors by Runx3.Development. 2008 May;135(9):1703-11. doi: 10.1242/dev.015248. Epub 2008 Apr 2. Development. 2008. PMID: 18385258
-
Runx3 controls the axonal projection of proprioceptive dorsal root ganglion neurons.Nat Neurosci. 2002 Oct;5(10):946-54. doi: 10.1038/nn925. Nat Neurosci. 2002. PMID: 12352981
-
Runx3 is essential for the _target-specific axon pathfinding of trkc-expressing dorsal root ganglion neurons.Blood Cells Mol Dis. 2003 Mar-Apr;30(2):157-60. doi: 10.1016/s1079-9796(03)00032-9. Blood Cells Mol Dis. 2003. PMID: 12732177
-
"Runx"ing towards sensory differentiation.Neuron. 2006 Feb 2;49(3):325-7. doi: 10.1016/j.neuron.2006.01.013. Neuron. 2006. PMID: 16446135 Review.
-
Role of neurotrophin signalling in the differentiation of neurons from dorsal root ganglia and sympathetic ganglia.Cell Tissue Res. 2009 Jun;336(3):349-84. doi: 10.1007/s00441-009-0784-z. Epub 2009 Apr 23. Cell Tissue Res. 2009. PMID: 19387688 Review.
Cited by
-
Characterization of the Gbx1-/- mouse mutant: a requirement for Gbx1 in normal locomotion and sensorimotor circuit development.PLoS One. 2013;8(2):e56214. doi: 10.1371/journal.pone.0056214. Epub 2013 Feb 13. PLoS One. 2013. PMID: 23418536 Free PMC article.
-
Retroviral insertional mutagenesis identifies RUNX genes involved in chronic myeloid leukemia disease persistence under imatinib treatment.Proc Natl Acad Sci U S A. 2007 Mar 13;104(11):4594-9. doi: 10.1073/pnas.0604716104. Epub 2007 Mar 5. Proc Natl Acad Sci U S A. 2007. PMID: 17360569 Free PMC article.
-
Comment on Levanon et al., "Runx3 knockouts and stomach cancer", in EMBO reports (June 2003).EMBO Rep. 2003 Jun;4(6):538-9. doi: 10.1038/sj.embor.embor875. EMBO Rep. 2003. PMID: 12776167 Free PMC article. No abstract available.
-
Transcription factors RUNX1 and RUNX3 in the induction and suppressive function of Foxp3+ inducible regulatory T cells.J Exp Med. 2009 Nov 23;206(12):2701-15. doi: 10.1084/jem.20090596. Epub 2009 Nov 16. J Exp Med. 2009. PMID: 19917773 Free PMC article.
-
POU-domain factor Brn3a regulates both distinct and common programs of gene expression in the spinal and trigeminal sensory ganglia.Neural Dev. 2007 Jan 19;2:3. doi: 10.1186/1749-8104-2-3. Neural Dev. 2007. PMID: 17239249 Free PMC article.
References
-
- Anderson D.J. (1999) Lineages and transcription factors in the specification of vertebrate primary sensory neurons. Curr. Opin. Neurobiol., 9, 517–524. - PubMed
-
- Arber S., Ladle,D.R., Lin,J.H., Frank,E. and Jessell,T.M. (2000) ETS gene Er81 controls the formation of functional connections between group Ia sensory afferents and motor neurons. Cell, 101, 485–498. - PubMed
-
- Avraham K.B., Levanon,D., Negreanu,V., Bernstein,Y., Groner,Y., Copeland,N.G. and Jenkins,N.A. (1995) Mapping of the runt domain gene, Aml2, to the distal region of mouse chromosome 4. Genomics, 25, 603–605. - PubMed
-
- Bae S.-C., Takahashi,E.-i., Zhang,Y.W., Ogawa,E., Shigesada,K., Namba,Y., Satake,M. and Ito,Y. (1995) Cloning, mapping and expression of PEBP2aC, a third gene encoding the mammalian runt domain. Gene, 159, 245–248. - PubMed
-
- Bangsow C. et al. (2001) The RUNX3 gene—sequence, structure and regulated expression. Gene, 279, 221–232. - PubMed
Publication types
MeSH terms
Substances
LinkOut - more resources
Full Text Sources
Other Literature Sources
Medical
Molecular Biology Databases

