. 2002 Dec 2;196(11):1403-14.
doi: 10.1084/jem.20020797.

A signal peptide derived from hsp60 binds HLA-E and interferes with CD94/NKG2A recognition

Affiliations

A signal peptide derived from hsp60 binds HLA-E and interferes with CD94/NKG2A recognition

Jakob Michaëlsson et al. J Exp Med. .

Abstract

Human histocompatibility leukocyte antigen (HLA)-E is a nonclassical major histocompatibility complex (MHC) class I molecule which presents a restricted set of nonameric peptides, derived mainly from the signal sequence of other MHC class I molecules. It interacts with CD94/NKG2 receptors expressed on the surface of natural killer (NK) cells and T cell subsets. Here we demonstrate that HLA-E also presents a peptide derived from the leader sequence of human heat shock protein 60 (hsp60). This peptide gains access to HLA-E intracellularly, resulting in up-regulated HLA-E/hsp60 signal peptide cell-surface levels on stressed cells. Notably, HLA-E molecules in complex with the hsp60 signal peptide are no longer recognized by CD94/NKG2A inhibitory receptors. Thus, during cellular stress an increased proportion of HLA-E molecules may bind the nonprotective hsp60 signal peptide, leading to a reduced capacity to inhibit a major NK cell population. Such stress induced peptide interference would gradually uncouple CD94/NKG2A inhibitory recognition and provide a mechanism for NK cells to detect stressed cells in a peptide-dependent manner.


Figures

Figure 1.
Figure 1.
The protein sequence of human hsp60. The mitochondrial _targeting signal is shown in gray. Boxed are the four peptide sequences displaying a methionine followed by leucine or isoleucine seven amino acids COOH-terminally, two important residues for binding to HLA-E pockets. Hsp60sp corresponds to residues 10–18 in the sequence (QMRPVSRVL).
Figure 2.
Figure 2.
Stabilization of HLA-E by hsp60sp and B7sp on K562 cells transfected either with HLA-E*0101 or HLA-E*01033. Cell surface expression of HLA-E*0101 (top panel) and HLA-E*01033 (bottom panel) after overnight incubation at 26°C with 300 μM of either hsp60sp (left panel, bold line) or B7sp (right panels, bold line). The dashed line represents HLA-E expression after incubation with 300 μM of a control peptide (P18I10). Cells were stained with anti-MHC class I mAb DX17, followed by RPE-conjugated goat anti–mouse IgG. The HLA-E expression was confirmed by staining with the anti–HLA-E mAb 3D12. Staining with isotype-matched control antibody is shown as shaded gray. 1 representative experiment out of more than 10 is shown.
Figure 3.
Figure 3.
Hsp60 signal peptide _targets GFP into mitochondria and the methionine residue at position 11 is not crucial for mitochondrial translocation. K562 cells were transfected with either a chimeric construct consisting of the wild-type full-length hsp60 signal peptide (residues 1–26) directly upstream and in frame of GFP (top panel, green), or a mutated variant of the full-length hsp60 signal peptide where the methionine at position 11 was replaced with a glycine (bottom panel, green). Both constructs _target GFP into mitochondria. Cells were counter stained with the mitochondrial probe TMRE (bright red) and the nuclear stain Hoechst 33342 (blue). An overlay of all colors is shown to the right.
Figure 4.
Figure 4.
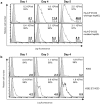
Up-regulation of HLA-E by overexpression of the full-length hsp60 signal peptide is enhanced by cellular stress. HLA-E surface expression was monitored on cells growing at increasing densities. Cells were collected and analyzed for HLA-E expression between day 1 and day 5 (as indicated on the top of the histograms). The numbers in the top right corner of each histogram indicate cell density (cells/ml) and percent viability at the time of analysis, respectively. The numbers in the bottom right corner of each histogram in panel a indicate the MFI of HLA-E expression (top, black) and the MFI of GFP (bottom, gray). The numbers in the lower right corner of each histogram in b indicate the MFI of HLA-E expression. All cells were stained with an HLA specific antibody (DX17, dashed line) or with control Ig (gray histogram), followed by RPE-conjugated goat anti–mouse IgG. (a) K562 cells cotransfected with HLA-E*01033 and the full-length (residues 1–26) wild-type hsp60 signal peptide-GFP construct (wild-type hsp60L, top panel) or mutant hsp60 signal peptide-GFP (mutated hsp60L, bottom panel), cultured at increasing cell density. A gate was set on GFP positive cells and 10 000 events were acquired within this gate. (b) K562 cells (top panel) and K562 transfected with HLA-E*01033 (K562 E*01033, bottom panel) cultured at increasing cell density. Note that the K562-E*01033 cell line in b and the cotransfected cell lines presented in panel a were generated and selected independently, which may account for the higher HLA-E background level observed at day 1. Therefore the absolute levels of HLA-E should not be directly compared between Fig. 4, a and b.
Figure 5.
Figure 5.
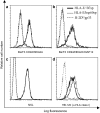
Binding of soluble HLA-E tetrameric molecules to CD94/NKG2 receptors. (a) Ba/F3 cells transfected with CD94 and NKG2A were incubated with HLA-E/B7sp tetramers- (bold line), HLA-E/hsp60sp-tetramers (thin line), or control H-2Db/gp33-tetramers (dashed line). (b) Ba/F3 cells transfected with CD94, NKG2C, and DAP-12 were incubated with HLA-E/B7sp-tetramers (bold line), HLA-E/hsp60sp-tetramers (thin line), or control H-2Db/gp33-tetramers (dashed line). (c) The NK cell line NKL was incubated with HLA-E/B7sp-tetramers (bold line), HLA-E/hsp60sp-tetramers (thin line), or control H-2Db/gp33-tetramers (dashed line). (d) HB-120 B cell hybridoma (anti-MHC class I) was incubated with HLA-E/B7sp-tetramers (bold line), HLA-E/hsp60sp-tetramers (thin line), or control H-2Db/gp33-tetramers (dashed line). All incubations were done at 4°C for 45 min in PBS supplemented with 1% FCS. HLA-E/hsp60sp-tetramers failed to bind both CD94/NKG2A+ and CD94/NKG2C+ cells over a range of HLA-E/hsp60sp-tetramer concentrations (not shown). This is one representative experiment of more than five.
Figure 6.
Figure 6.
Hsp60sp fails to protect K562-E*01033 cells from killing by NK cells. K562-E*01033 cells were incubated with the different peptides at 26°C for 15–20 h, and then tested in 2h 51Cr release assays. To ensure that the levels of HLA-E presenting a protective peptide, and not the HLA-E levels as such, provided the protective capacity we kept the nonprotective peptides, but omitted the B7sp, during the killing assays. (a) Killing of K562-E*01033 cells by NKL (left) or Nishi (right) after incubation with 300 μM P18I10 control peptide, 300 μM hsp60sp, or 30 μM B7sp. 50 μM of P18I10 control peptide and hsp60sp was also included during the assays. Data from an E:T ratio of 30:1 is shown. The figure represents the mean of at least three experiments. Error bars indicate standard error of the mean. (b) Killing of K562-E*01033 cells by NKL (left panel) or Nishi (right panel) incubated over night with 30 μM B7sp, 300 μM P18I10 (pCtrl), 300 μM B7 R5V, 300 μM hsp60sp, or 300 μM hsp60 V5R. 50 μM of all peptides, except B7sp, were included during the assay. Peptide concentrations were chosen according to (c). The figure represents the mean of at least three experiments. Error bars indicate standard error of the mean. (c) HLA-E cell surface expression by K562-E*01033 after the assay. A cold _target preparation was prepared in parallel as in a and b, and was stained with DX17 mAb (anti-HLA class I), followed by RPE-conjugated goat anti–mouse IgG after the 2-h assay. One representative example out of more than five is shown. Note that, as in a and b, 50 μM of all peptides, except for B7sp, was present during the time of the assay, explaining the lower HLA-E expression with B7sp compared with Hsp60sp, Hsp60 V5R, and B7 R5V. (d) Killing of K562-E*01033 cells by Nishi after incubation for 30 min at room temperature with 0.1 μM B7sp and increasing amounts of competing peptides (hsp60sp, hsp60.4, B7 R5V, and P18I10). All the peptides were kept throughout the assay.
Figure 7.
Figure 7.
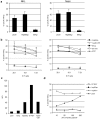
Increased HLA-E cell surface levels on K562-E*01033 after cellular stress does not protect from NK cell mediated killing. (a) Killing of K562-E*01033 cells (grown at increasing cell densities as in Fig. 4 b) by NKL in a 2-h 51Cr release assay. (b) Same experimental setting as above, in the presence of 100 μM B7sp. Closed circles, high density; open squares, medium density; closed triangles, low density. (c) HLA-E expression on the K562-E*l01033 cells after culture at increasing cell density.

Comment in

Similar articles

Cited by

References

    1. Lanier, L.L. 1998. NK cell receptors. Annu. Rev. Immunol. 16:359–393. - PubMed
    1. Drickamer, K. 1999. C-type lectin-like domains. Curr. Opin. Struct. Biol. 9:585–590. - PubMed
    1. Boyington, J.C., A.G. Brooks, and P.D. Sun. 2001. Structure of killer cell immunoglobulin-like receptors and their recognition of the class I MHC molecules. Immunol. Rev. 181:66–78. - PubMed
    1. Vance, R.E., J.R. Kraft, J.D. Altman, P.E. Jensen, and D.H. Raulet. 1998. Mouse CD94/NKG2A is a natural killer cell receptor for the nonclassical major histocompatibility complex (MHC) class I molecule Qa-1(b). J. Exp. Med. 188:1841–1848. - PMC - PubMed
    1. Braud, V.M., D.S. Allan, C.A. O'Callaghan, K. Söderström, A. D'Andrea, G.S. Ogg, S. Lazetic, N.T. Young, J.I. Bell, J.H. Phillips, et al. 1998. HLA-E binds to natural killer cell receptors CD94/NKG2A, B and C. Nature. 391:795–799. - PubMed

Publication types

MeSH terms

  NODES
Note 2
twitter 2