Comparative Study
. 2003 Mar 17;22(6):1235-44.
doi: 10.1093/emboj/cdg122.

Mrs2p is an essential component of the major electrophoretic Mg2+ influx system in mitochondria

Affiliations
Comparative Study

Mrs2p is an essential component of the major electrophoretic Mg2+ influx system in mitochondria

Martin Kolisek et al. EMBO J. .

Abstract

Steady-state concentrations of mitochondrial Mg(2+) previously have been shown to vary with the expression of Mrs2p, a component of the inner mitochondrial membrane with two transmembrane domains. While its structural and functional similarity to the bacterial Mg(2+) transport protein CorA suggested a role for Mrs2p in Mg(2+) influx into the organelle, other functions in cation homeostasis could not be excluded. Making use of the fluorescent dye mag-fura 2 to measure free Mg(2+) concentrations continuously, we describe here a high capacity, rapid Mg(2+) influx system in isolated yeast mitochondria, driven by the mitochondrial membrane potential Deltapsi and inhibited by cobalt(III)hexaammine. Overexpression of Mrs2p increases influx rates 5-fold, while the deletion of the MRS2 gene abolishes this high capacity Mg(2+) influx. Mg(2+) efflux from isolated mitochondria, observed with low Deltapsi only, also requires the presence of Mrs2p. Cross-linking experiments revealed the presence of Mrs2p-containing complexes in the mitochondrial membrane, probably constituting Mrs2p homo- oligomers. Taken together, these findings characterize Mrs2p as the first molecularly identified metal ion channel protein in the inner mitochondrial membrane.


Figures

None
Fig. 1. Original record of an Mg2+ measurement with yeast mitochondria and of the calibration procedure. Mag-fura 2 emission at a wavelength of 510 nm was measured upon excitation at 380 and 340 nm (standard excitation wavelength for the free mag-fura 2 and for the ion-bound mag-fura 2, respectively). (A) Single wavelength fluorescence intensities of mag-fura 2-loaded yeast mitochondria as a function of time and [Mg2+]e. Measurements were started with mag-fura 2-loaded mitochondria in essentially Mg2+-free buffer (see Materials and methods). Mg2+ was added to final concentrations of 1, 5 and 10 mM. [Mg2+]e was raised to 25 mM before the addition of SDS, resulting in Rmax, and the addition of EDTA led to Rmin values. Inset: autofluorescence of mag-fura 2-unloaded mitochondria. (B) The 340/380 nm ratio of the fluorescence intensities shown in Figure 2A. Note that increases in the ratio are caused by an increase in the 340 nm intensity and a decrease in the 380 nm intensity, indicating that changes in the ratio are due in fact to alterations in the ratio of [Mg2+:mag-fura 2]/[mag-fura 2]. (C) Effect of an increase of the extramitochondrial [Ca2+] on the 340/380 nm ratio of the fluorescence intensities.
None
Fig. 2. Effect of the expression and functionality of Mrs2p on [Mg2+]m, total [Mg2+] and group II intron splicing. Ratios of fluorescence intensities as displayed in Figure 1A were used for the calculation of [Mg2+]m values using the formula of Grynkiewicz et al. (1985) as described in Materials and methods. Mitochondria were isolated from cells expressing a single chromosomal copy of MRS2 (WT), from cells expressing Mrs2p from multicopy vector pVT-U 103 [(MRS2)n] and from cells with a disruption in the MRS2 gene (Δmrs2). (A) Effect of variation in extramitochondrial [Mg2+] on [Mg2+]m of WT, (MRS2)n and Δmrs2 mitochondria. Representative original recordings for [Mg2+]m are shown. Inset: initial 5 s response after increasing [Mg2+]e to 1 mM. Note the differences in the slopes of the tracings from the various mitochondria types, reflecting that Mg2+ uptake rates depend on Mrs2p expression. (B) Effect of variation in extramitochondrial [Mg2+] on total Mg2+, Ca2+ and K+ concentrations of wild-type MRS2 yeast mitochondria. Atomic absorption spectroscopy was applied on mag-fura 2-loaded yeast mitochondrial suspensions without added Mg2+ and 60 s after addition of Mg2+ to final concentrations as indicated. (C) Effects of an amino acid substitution in the critical F/Y-G-M-N motif on [Mg2+]m and group II intron RNA splicing. By site-directed mutation, a base substitution G998→C998 was introduced into the MRS2 gene (mrs2-J1 allele), resulting in a glycine to alanine substitution in the F/Y-G-M-N motif, characteristic of the CorA, Mrs2 and Alr1 proteins. Cells lacking the chromosomal MRS2 copy (mrs2Δ) were transformed with pVT-U 103 multicopy plasmids lacking any insert (mrs2Δ) or expressing the wild-type MRS2 allele [mrs2Δ (MRS2)n] or the mrs2-J1 mutant allele [mrs2Δ (mrs2-J1)n]. Representative [Mg2+]m values of the three transformants are compared. Inset: RT–PCR amplification of the exon–exon B1–B2 junction from spliced RNA and of the exon–intron B1–bI1 junction from precursor RNA of the mitochondrial cytochrome b gene. Primers used, assay conditions and visualization of PCR products were as described previously by Gregan et al. (2001).
None
Fig. 3. Effects of inhibitors of mitochondrial functions on Mg2+ influx into wild-type mitochondria. (A) Steady-state [Mg2+]m values measured under various experimental conditions. The resting [Mg2+]m (left bars) was determined in nominally Mg2+-free buffer after pre-incubation of wild-type mitochondria in the presence of the respective compounds as indicated. Afterwards, [Mg2+]e was increased to 1 mM (uptake conditions). The 50 s plateau level of [Mg2+]m after the addition of Mg2+ (right bars) is given. (B) Effect of nigericin. Isolated mitochondria were suspended in SH buffer with or without nigericin; after a 10 min pre-incubation, Mg2+ uptake was induced by increasing [Mg2+]e to 1 mM. (C) Effect of valinomycin. Isolated mitochondria were suspended in KCl buffer with or without valinomycin; after a 30 min pre-incubation, Mg2+ uptake is induced by increasing [Mg2+]e to 1 mM.
None
Fig. 4. Effect of nigericin and valinomycin on the transmembrane voltage (Δψ) of wild-type and mrs2Δ mutant mitochondria. For further details, see Results.
None
Fig. 5. Mg2+ efflux from Mg2+-loaded isolated wild-type and mrs2Δ mutant mitochondria. Mg2+ efflux was measured as the decrease in the [Mg2+]m of Mg2+-loaded mitochondria resuspended in nominally Mg2+-free, high-K+ buffer. Loading was performed by incubation of mitochondria for 35 min in high-K+ medium containing 10 mM Mg2+ (wild-type mitochondria) or 10 mM Mg2+ and the ionophore A23187 (mrs2Δ mitochondria). By this procedure, steady-state [Mg2+]m levels were raised to 5.1 and 6.2 mM in wild-type and mrs2Δ mutant mitochondria, respectively (t 0′) Mitochondria were than washed twice in high-Mg2+, high-K+ buffer, supplemented with 1.5% albumin to remove the ionophore, and resuspended in a nominally Mg2+-free KCl buffer with additions as given in the table at the top. Steady-state [Mg2+]m after 30 min in the respective solution is shown (t 30′).
None
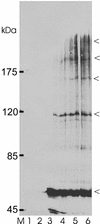
Fig. 6. Mrs2-HA products detected upon chemical cross-linking. Isolated mitochondria of wild-type cells without (lanes 1 and 2) and transformed with YEp351 MRS2-HA (lanes 3–5) were incubated in SH buffer on ice without cross-linker (lanes 1 and 3) or with the chemical cross-linker oPDM (see Materials and methods) at final concentrations of 10 µM (lane 4), 30 µM (lane 5) and 100 µM (lanes 2 and 6), separated by SDS–PAGE and analyzed by immunoblotting with an HA antiserum.
None
Fig. 7. Intramitochondrial free Mg2+ concentrations [Mg2+]m as a function of [Mg2+]e as observed for yeast mitochondria (inverted triangles), and as expected (circles) when Mg2+ would come to an electrochemical equilibrium across the mitochondrial membranes with a membrane potential of 160 mV (inside negative).

Similar articles

Cited by

References

    1. Baumann F., Neupert,W. and Herrmann,J.M. (2002) Insertion of bitopic membrane proteins into the inner membrane of mitochondria involves an export step from the matrix. J. Biol. Chem., 277, 21405–21413. - PubMed
    1. Bui D.M., Gregan,J., Jarosch,E., Ragnini,A. and Schweyen,R.J. (1999) The bacterial Mg2+ transporter CorA can functionally substitute for its putative homologue Mrs2p in the yeast inner mitochondrial membrane. J. Biol. Chem., 274, 20438–20443. - PubMed
    1. Diwan J.J. (1987) Mitochondrial transport of K+ and Mg2+. Biochim. Biophys. Acta, 895, 155–165. - PubMed
    1. Diwan J.J., Daze,M., Richardson,R. and Aronson,D. (1979) Kinetics of Mg2+ flux into rat liver mitochondria. Biochemistry, 18, 2590–2595. - PubMed
    1. Graschopf A., Stadler,J.A., Hoellerer,M.K., Eder,S., Sieghardt.M., Kohlwein,S.D. and Schweyen R.J. (2001) The yeast plasma membrane protein Alr1 controls Mg2+ homeostasis and is subject to Mg2+-dependent control of its synthesis and degradation. J. Biol. Chem., 276, 16216–16222. - PubMed

Publication types

MeSH terms

  NODES
Note 6
twitter 2