. 2003 Jul 2;23(13):5835-45.
doi: 10.1523/JNEUROSCI.23-13-05835.2003.

Intracellular patch electrochemistry: regulation of cytosolic catecholamines in chromaffin cells

Affiliations

Intracellular patch electrochemistry: regulation of cytosolic catecholamines in chromaffin cells

Eugene V Mosharov et al. J Neurosci. .

Abstract

Alterations in the cytosolic pool directly affect neurotransmitter synthesis and release and are suggested to be key factors in various neurodegenerative disorders. Although this cytosolic pool is the most metabolically active, it is miniscule compared with the amount of vesicular transmitter and has never been quantified separately. Here, we introduce intracellular patch electrochemistry (IPE), a technique that for the first time provides direct measurements of cytosolic oxidizable molecules in single mammalian cells. In amperometric mode, IPE detects total catechols, whereas in cyclic voltammetric mode, it preferentially measures catecholamines. In cultured chromaffin cells, the total cytosolic catechol concentration was 50-500 microm, of which approximately 10% were catecholamines. Reserpine, a vesicular monoamine transporter inhibitor, had no effect on the catecholamine pool but increased total catechols by fourfold to fivefold. Combined with pargyline, a monoamine oxidase inhibitor, reserpine increased catecholamine levels in the cytosol by approximately sixfold. Amphetamine induced a transient approximately fivefold accumulation of cytosolic catecholamines and a slow increase of total catechols. In cells incubated with 3,4-dihydroxy-L-phenylalanine (L-DOPA), catecholamines increased by approximately 2.5-fold and total catechols increased by approximately fourfold. Cytosolic catecholamines returned to control levels <or=10 min after L-DOPA withdrawal, whereas total catechols remained approximately twofold elevated even after a 1.5 hr incubation in L-DOPA-free media. Our data indicate that cytosolic catecholamines are strictly maintained at a defined level, and drug-induced increases in their concentrations lead to the accumulation of other catecholamine derivatives, such as DOPAC and 3,4-dihydroxyphenylethyleneglycol. These derivatives reside in the cytosol for hours after treatment and may be an underlying cause of drug-related cytotoxicity.


Figures
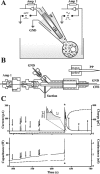
Figure 1.
Figure 1.
A, Schematic diagram of the IPE setup. Amp 1, Amp 2, Amplifiers; GND, electric ground; CFE, carbon fiber electrode; PP, patch pipette. B, Design of the IPE electrode holder. Two Ag|AgCl wires are connected to the GND and Amp 1 via golden-plated pins. The ground wire is in contact with the PP saline; an electrode wire supplies electric current to the CFE via polyethylene tubing filled with 3 m KCl. Air tightness between different compartments inside the holder is achieved by four rubber O-rings. C, An amperometric recording from a bovine chromaffin cell in which measurement of quantal release of catecholamines by patch amperometry is followed by IPE in amperometric mode. Asterisks indicate the time when the patch was disrupted by suction and a whole-cell configuration was attained. Amperometric current from the CFE (top, solid line), its running integral (top, dashed line), membrane capacitance (bottom, solid line), and conductance (bottom, dashed line) were monitored simultaneously during the same recording. Quantal events in the patch are indicated by amperometric spikes and capacitance steps (arrows). In ∼50% of the recordings, the slow amperometric current wave had superimposed quantal spikes, indicating vesicles diffusing out of the cell and bursting on contact with the CFE (arrowheads). The inset displays a magnification of the initial phase of the slow oxidation wave. The first sharp peak from the left is an artifact resulting from suction. The gray area shows the portion of the peak considered to represent the cytosolic molecules.
Figure 2.
Figure 2.
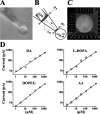
A, An example of a photograph obtained before each recording and used to calculate the dilution of molecules inside the patch pipette (see Materials and Methods). B, Estimation of the cytosolic volume, Vcell, and the volume inside the patch pipette, Vpipette, that contributed to the dilution of intracellular content. C, A three-dimensional reconstruction of a calcein-AM-stained bovine chromaffin cell scanned by confocal microscopy. D, Concentration dependence of amperometric currents for DA, l-DOPA, DOPEG, and ascorbic acid in double logarithmic plots fit by linear functions. Calibration coefficients for these and other compounds are listed in Table 1.
Figure 3.
Figure 3.
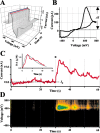
Analysis of CV recordings from a single rat chromaffin cell. A, A representative recording shown as a three-dimentional matrix of data. Red and blue lines represent samplings of the current at 400 and 0 mV, respectively. B, Voltammogram of catecholamines released during the same recording. A subtraction was made between 10 consecutive averaged I–V profiles at 10 sec from those at 33 sec. Dashed line indicates ΔI, the height of DA oxidation peak. C, Current sampled at 400 mV oxidation potential. The asterisk indicates a time when the patch was disrupted by suction and a whole-cell configuration was attained. The inset shows a random walk fit (green) of the sampled current trace (red) using 15 MΩ access resistance, 8 μm cell radius, 60μm distance between the CFE and the pipette tip, and 6.7μm cytosolic catecholamine concentration. D, Pseudo-three-dimensional representation of approximate voltammograms of intracellular metabolites encountering the CFE during the recording, in which the intensity of color (“Planet Earth” color table) indicates the current at a given voltage and time. The algorithm used to calculate catecholamine concentration in this recording is discussed in Results.
Figure 4.
Figure 4.
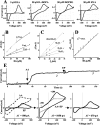
Estimation of cytosolic catecholamine concentrations in CV mode. A, Voltammograms of DA and related compounds. B, DA concentration dependencies of ΔI observed using electrodes with different IB. C, Relationship between IB and ΔI at different DA concentrations. D, Calibration curve for DA in a double-logarithmic plot fit by a linear function. ΔInorm was calculated using formula image = 30 nA. Calibration coefficients for DA and other metabolites are listed in Table 1. E, Subtraction of AA contribution from voltammograms. The top panel shows the current sampled at 350 mV, in which arrows indicate the additions of 400 μm AA and 5 μm EP. Bottom, left, Voltammograms of AA alone (dashed line; subtraction voltammogram between points 1 and 2 on the sampled current trace) and EP alone (solid line; subtraction voltammogram between points 2 and 3). Bottom, middle, Voltammogram of the AA and EP mixture (solid line; subtraction voltammogram between points 1 and 3). Dotted lines represent the estimated AA contribution to the voltammogram (see Results). Bottom, right, Original EP voltammogram was approximated as a difference between two traces shown in the bottom middle panel. ΔI on voltammograms was calculated between currents that corresponded to 0 and 350 mV oxidation potentials.
Figure 5.
Figure 5.
Cytosolic catechols and catecholamines in untreated chromaffin cells. A, Cytosolic concentrations of total catechols measured amperometrically (top) and catecholamines measured by CV (bottom) in chromaffin cells at different days in culture. Continuous lines are single exponential fits. B, Distributions of total cytosolic catechol levels in bovine chromaffin cells at day 1 (left), days 2–4 (middle), and days 5–7 (right) in culture (bin size, 40 μm). The inset in the right panel shows the same data points grouped into 20 μm bins. C, Distributions of cytosolic catecholamines (left; bin size, 3 μm) and total catechols (right; bin size, 20 μm) in rat chromaffin cells at days 2–4 after culture. D, Mean concentrations of total cytosolic catechols (white) and catecholamines (gray) recorded using high Ca extracellular (saline A2 or B1) and low Ca intracellular (saline A3 or B2) patch pipette solutions (see Materials and Methods for compositions).
Figure 6.
Figure 6.
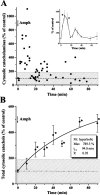
Catecholamine homeostasis in rat chromaffin cells after amphetamine treatment. A, Cytosolic concentrations of catecholamines measured by IPE in CV mode in cells exposed to 50 μm amphetamine (added at time 0). Each point represents one cell; inset displays the same data points grouped into time bins (binsize, 5 min for 0–35 min and 15 min for 35–80 min time points; mean ± SEM). The data shown are from eight independent experiments. B, Total cytosolic catechols measured by IPE in amperometric mode. Data from three independent experiments are shown as mean ± SEM (n = 3–6 for each time point). Shaded areas represent one SD from the mean level of catecholamine or catechol concentrations in untreated chromaffin cells. Asterisks indicate a significant difference from untreated cells (p < 0.001; ANOVA test).
Figure 7.
Figure 7.
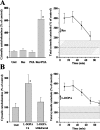
Effects of reserpine, pargyline, and l-DOPA on cytosolic catecholamine homeostasis in rat chromaffin cells. A, Cytosolic catecholamine concentrations measured by IPE in CV mode (left) and total catechols measured by amperometric mode (right) in cells exposed to 1 μm reserpine and 10 μm pargyline. Left, Reserpine-treated group represents cells incubated with the drug for 5–60 min. Cells were pretreated with pargyline for 30 min before measurements or the addition of reserpine, which was added for 15 min. After the treatments (37°C; 7% CO2), the media were replaced with saline B1 containing the same drugs. Measurements were performed at RT during 60 min after the treatments. The following is the number of points in cells: untreated, n = 22; reserpine-treated, n = 21; pargyline-treated, n = 16; pargyline and reserpine-treated, n = 28. Right, Reserpine was added at time 0. Combined data from three experiments are grouped into 20 min time bins with n = 13–24 for different time point. B, Cytosolic concentrations of catecholamines (left) and total catechols (right) after cell exposure to 100 μm l-DOPA. Left, Middle bar represents cytosolic catecholamine concentration in chromaffin cells incubated with l-DOPA for 1–1.5 hr; recordings were made in the presence of l-DOPA. The right bar represents the level of catecholamines in cells preincubated with l-DOPA for 1 hr and washed twice with l-DOPA-free medium (10–60 min after l-DOPA withdrawal). The following is the number of points in cells: untreated, n = 25; l-DOPA-treated, 24; cells pretreated with l-DOPA after l-DOPA withdrawal, 17. Right, Time course of changes in the level of total cytosolic catechols after l-DOPA withdrawal. Data from four independent experiments are grouped into 20 min time bins (n = 14–24 for different time points). Data shown as mean ± SEM. Shaded areas represent one SD from the mean catechol concentrations in untreated chromaffin cells. All time points in the right panels and those that have asterisks in the left panels are significantly different from untreated cells (p < 0.001; ANOVA test).

Similar articles

Cited by

References

    1. Ahlskog JE, Uitti RJ, Low PA, Tyce GM, O'Brien JF, Nickander KK ( 1996) Levodopa and deprenyl treatment effects on peripheral indices of oxidant stress in Parkinson's disease. Neurology 46: 796-801. - PubMed
    1. Albillos A, Dernick G, Hostmann H, Almers W, Alvarez de Toledo G, Lindau M ( 1997) The exocytic event in chromaffin cells revealed by patch amperometry. Nature 389: 509-512. - PubMed
    1. Anderson BB, Chen G, Gutman DA, Ewing AG ( 1998) Dopamine levels of two classes of vesicles are differentially depleted by amphetamine. Brain Res 788: 294-301. - PubMed
    1. Bader MF, Holz RW, Kumakura K, Vitale N ( 2002) Exocytosis: the chromaffin cell as a model system. Ann NY Acad Sci 971: 178-183. - PubMed
    1. Baur JE, Kristensen EW, May LJ, Wiedemann DJ, Wightman RM ( 1988) Fast-scan voltammetry of biogenic amines. Anal Chem 60: 1268-1272. - PubMed

Publication types

MeSH terms

LinkOut - more resources

  NODES
twitter 2