. 2003 Jul 7;162(1):59-69.
doi: 10.1083/jcb.200302084.

Bax and Bak can localize to the endoplasmic reticulum to initiate apoptosis

Affiliations

Bax and Bak can localize to the endoplasmic reticulum to initiate apoptosis

Wei-Xing Zong et al. J Cell Biol. .

Abstract

Bax and Bak play a redundant but essential role in apoptosis initiated by the mitochondrial release of apoptogenic factors. In addition to their presence at the mitochondrial outer membrane, Bax and Bak can also localize to the ER. Agents that initiate ER stress responses can induce conformational changes and oligomerization of Bax on the ER as well as on mitochondria. In wild-type cells, this is associated with caspase 12 cleavage that is abolished in bax-/-bak-/- cells. In bax-/-bak-/- cells, introduction of Bak mutants selectively _targeted to either mitochondria or the ER can induce apoptosis. However, ER-_targeted, but not mitochondria-_targeted, Bak leads to progressive depletion of ER Ca2+ and induces caspase 12 cleavage. In contrast, mitochondria-_targeted Bak leads to enhanced caspase 7 and PARP cleavage in comparison with the ER-_targeted Bak. These findings demonstrate that in addition to their functions at mitochondria, Bax and Bak also localize to the ER and function to initiate a parallel pathway of caspase activation and apoptosis.


Figures

Figure 1.
Figure 1.
Bax and Bak are localized to the ER in addition to their mitochondrial location. (A) Wild-type and bax / bak / MEFs as well as HeLa cells were resuspended in hypotonic buffer A and disrupted. Subcellular fractionation was performed to obtain the fractions for cytosol (S-100), HM (mitochondria enriched), and LM (the ER enriched). 20 μg of total protein from each fraction was separated on a 4–12% gradient NuPAGE gel. Antibodies against Bax, Bak, calnexin, and Cox IV were used for immunoblotting. (B) Mouse liver was homogenized in buffer A and fractionated in sucrose gradient as described in the Materials and methods. Fractions from crude mitochondria and the 1.5/1.8 M sucrose interface were probed with indicated antibodies. (C) The LM fraction was not contaminated by mitochondrial outer membrane. Fractions of wild-type MEFs were probed with an anti-Tom40 antibody. (D) Immunoelectron microscopy of Bax (left) and Bak (right) in wild-type MEFs using 10-nm gold particles. The bottom panels are the enlargements of the boxed areas of the top images. The arrowheads point to the ER. mt, mitochondria.
Figure 1.
Figure 1.
Bax and Bak are localized to the ER in addition to their mitochondrial location. (A) Wild-type and bax / bak / MEFs as well as HeLa cells were resuspended in hypotonic buffer A and disrupted. Subcellular fractionation was performed to obtain the fractions for cytosol (S-100), HM (mitochondria enriched), and LM (the ER enriched). 20 μg of total protein from each fraction was separated on a 4–12% gradient NuPAGE gel. Antibodies against Bax, Bak, calnexin, and Cox IV were used for immunoblotting. (B) Mouse liver was homogenized in buffer A and fractionated in sucrose gradient as described in the Materials and methods. Fractions from crude mitochondria and the 1.5/1.8 M sucrose interface were probed with indicated antibodies. (C) The LM fraction was not contaminated by mitochondrial outer membrane. Fractions of wild-type MEFs were probed with an anti-Tom40 antibody. (D) Immunoelectron microscopy of Bax (left) and Bak (right) in wild-type MEFs using 10-nm gold particles. The bottom panels are the enlargements of the boxed areas of the top images. The arrowheads point to the ER. mt, mitochondria.
Figure 2.
Figure 2.
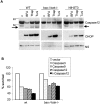
ER stress induces Bax and Bak conformational changes and oligomerization at the ER. (A) ER stresses induce the conformational changes of Bax and Bak. HeLa, MCF7, and 293T cells were treated with thapsigargin (Thap; 2 μM) or tunicamycin (Tuni; 5 μg/ml) for 36 h. Cells were fixed in 0.25% paraformaldehyde in PBS for 5 min. Cells were incubated with a control antibody (mouse IgG1) and conformation-sensitive antibodies against Bax or Bak, followed by incubation with FITC-conjugated secondary antibody. (B) ER stress induces Bax oligomerization at the ER. Wild-type MEFs were treated with brefeldin A (BFA; 10 μg/ml), Thap (2 μM), or Tuni (10 μg/ml) for 24 h. Cells were resuspended in hypotonic buffer A and disrupted. 5 mM BMH cross-linking reagent was added to cross-link the oligomerized proteins. Cells were subjected to subcellular fractionation to obtain the HM and LM fractions. 20 μg of total protein was separated on a 4–12% gradient NuPAGE gel. A polyclonal anti-Bax antibody was used to detect Bax. COX IV and calnexin are shown as indicators of the purity of the fractionation and as loading controls.
Figure 2.
Figure 2.
ER stress induces Bax and Bak conformational changes and oligomerization at the ER. (A) ER stresses induce the conformational changes of Bax and Bak. HeLa, MCF7, and 293T cells were treated with thapsigargin (Thap; 2 μM) or tunicamycin (Tuni; 5 μg/ml) for 36 h. Cells were fixed in 0.25% paraformaldehyde in PBS for 5 min. Cells were incubated with a control antibody (mouse IgG1) and conformation-sensitive antibodies against Bax or Bak, followed by incubation with FITC-conjugated secondary antibody. (B) ER stress induces Bax oligomerization at the ER. Wild-type MEFs were treated with brefeldin A (BFA; 10 μg/ml), Thap (2 μM), or Tuni (10 μg/ml) for 24 h. Cells were resuspended in hypotonic buffer A and disrupted. 5 mM BMH cross-linking reagent was added to cross-link the oligomerized proteins. Cells were subjected to subcellular fractionation to obtain the HM and LM fractions. 20 μg of total protein was separated on a 4–12% gradient NuPAGE gel. A polyclonal anti-Bax antibody was used to detect Bax. COX IV and calnexin are shown as indicators of the purity of the fractionation and as loading controls.
Figure 3.
Figure 3.
Caspase 12 functions downstream of the multidomain proapoptotic Bcl-2 family proteins. (A) ER stress–induced caspase 12 cleavage is dependent on Bax and Bak. Immortalized wild-type and bax / bak / MEFs and NIH3T3 cells were treated with brefeldin A (BFA; 10 μg/ml), thapsigargin (Thap; 2 μM), or tunicamycin (Tuni; 10 μg/ml) for 30 h. Caspase 12 level and processing were examined by immunoblotting of 20 μg of total cellular protein from samples as indicated. An ∼42-kD caspase 12 fragment is indicated by the arrow. Induction of CHOP expression is shown as an indicator of the ER stress response. A nonspecific band (NS) is shown as a loading control. (B) Caspase 12 kills bax / bak / cells. Wild-type and bax / bak / MEFs were cotransfected with pEGFP and constructs expressing caspase 3, caspase 9, caspase 12, and t-caspase 12. 24 h after transfection, cells were stained with DAPI, and cell death percentage was determined by the ratio of DAPI-positive to GFP-positive cells.
Figure 4.
Figure 4.
Generation of mitochondrial- and the ER- _targeted Bak mutants. (A) Schemes of the Bak mutants. The carboxy-terminal transmembrane domain of Bak was deleted (ΔC) or replaced with the mitochondria-_targeting sequence of ActA (ActA) or the ER-_targeting sequence of cb5. (B) _targeting the Bak mutants to mitochondria and the ER. Bak mutants were expressed in MCF7 cells. Mitochondria marker COX IV and the ER marker calnexin were visualized by immunofluorescence. Note that the Bak-ActA mutant colocalized with COX IV but not calnexin, and the Bak-cb5 mutant colocalized with calnexin but not COX IV.
Figure 5.
Figure 5.
The ER-_targeted Bak-cb5 induces depletion of the ER Ca2 + pool. (A) Cells with ER-_targeted Bak lack thapsigargin-releasable intracellular Ca2+. bax / bak / cells were infected with retroviruses encoding GFP, Bak-IRES-GFP, Bak-ActA-IRES-GFP, or Bak-cb5-IRES-GFP. 48 h after infection, cells were loaded with Indo-1, and the ER Ca2+ release was measured by flow cytometry. Propidium iodide was added to determine the cell viability. The Ca2+ flux traces were derived from gated live GFP-positive cells. The [Ca2+]i was calibrated from the measured Indo-1 fluorescence ratio as described in the Materials and methods. The arrowhead indicates the time of thapsigargin addition. (B) Expression of ER-_targeted Bak depleted intracellular Ca2+ storage in the ER. At the start of measurement, extracellular free Ca2+ concentration was reduced to zero. The arrowhead indicates the time when the extracellular free Ca2+ concentration was brought back to 2 mM. [Ca2+]i was analyzed as in A. (C and D) bax / bak / cells were infected with the Bak-cb5-IRES-GFP. (C) The measured Indo-1 fluorescence ratio between λ405 and λ475 is presented as an index of change in cytosolic [Ca2+] over time and presented separately for gated live GFP-positive (expressing Bak-cb5) or GFP-negative (not expressing Bak-cb5) cells. The absolute [Ca2+]i in the linear range is indicated on the right. The arrowhead indicates the time of thapsigargin addition. The arrow indicates the time of the addition of 8 mM CaCl2 to the medium. (D) Mitochondrial potential in GFP-positive (expressing Bak-cb5, green) and in GFP-negative (not expressing Bak-cb5, black) cells was measured by tetramethyl rhodamine ethyl ester (TMRE) staining.
Figure 6.
Figure 6.
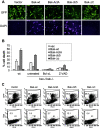
The ER-_targeted Bak can induce apoptosis in the absence of endogenous Bax and Bak. Wild-type and bax / bak / MEFs were infected with retroviruses expressing GFP or GFP together with wild-type murine Bak, Bak-ActA, Bak-cb5, or Bak-ΔC. 48 h after infection, 1 μg/ml DAPI was added to stain the apoptotic cells. (A) bax / bak / cells were photographed using a FITC or DAPI filter. (B) The percentage of dead cells was determined by the ratio of DAPI-positive cells to GFP-positive cells. In addition to the retroviral infection of the Bak mutants, bax / bak / cells were also coinfected with retrovirus expressing Bcl-xL, or infected in the presence of 20 μg/ml Z-VAD-fmk. Data shown are the average of three independent experiments. (C) 24 h after infection, bax / bak / cells were trypsinized. A portion of each sample was subjected to FACS® to determine the expression efficiency indicated by GFP-positive cells. The rest of the cells were fixed in 0.25% paraformaldehyde and stained with an anti-Bak antibody that recognizes the active form of murine Bak. The number in each dot plot represents the percentage of gated events (R1).
Figure 7.
Figure 7.
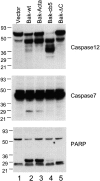
ER-_targeted Bak can induce selective cleavage of caspase 12, but not of caspase 7. bax / bak / cells were infected with GFP vector control, Bak-IRES-GFP, Bak-ActA-IRES-GFP, Bak-cb5-IRES-GFP, and Bak-ΔC-IRES-GFP at a high multiplicity. After infection, cells were lysed. Caspase 12, caspase 7, or PARP were detected by immunoblotting using respective antibodies.
Figure 8.
Figure 8.
Bax and Bak localized to the ER can initiate apoptosis. In addition to their mitochondrial localization and activity, Bax and Bak also reside at the ER. Upon ER stress treatment, Bax and Bak can initiate apoptosis from the ER.

Similar articles

Cited by

References

    1. Abeele, F.V., R. Skryma, Y. Shuba, F. Van Coppenolle, C. Slomianny, M. Roudbaraki, B. Mauroy, F. Wuytack, and N. Prevarskaya. 2002. Bcl-2-dependent modulation of Ca(2+) homeostasis and store-operated channels in prostate cancer cells. Cancer Cell. 1:169–179. - PubMed
    1. Akao, Y., Y. Otsuki, S. Kataoka, Y. Ito, and Y. Tsujimoto. 1994. Multiple subcellular localization of bcl-2: detection in nuclear outer membrane, endoplasmic reticulum membrane, and mitochondrial membranes. Cancer Res. 54:2468–2471. - PubMed
    1. Allen, E., Q.C. Yu, and E. Fuchs. 1996. Mice expressing a mutant desmosomal cadherin exhibit abnormalities in desmosomes, proliferation, and epidermal differentiation. J. Cell Biol. 133:1367–1382. - PMC - PubMed
    1. Annis, M.G., N. Zamzami, W. Zhu, L.Z. Penn, G. Kroemer, B. Leber, and D.W. Andrews. 2001. Endoplasmic reticulum localized Bcl-2 prevents apoptosis when redistribution of cytochrome c is a late event. Oncogene. 20:1939–1952. - PubMed
    1. Cecconi, F., G. Alvarez-Bolado, B.I. Meyer, K.A. Roth, and P. Gruss. 1998. Apaf1 (CED-4 homolog) regulates programmed cell death in mammalian development. Cell. 94:727–737. - PubMed

Publication types

MeSH terms

  NODES
Note 1
twitter 2