. 2003 Dec;1(3):E59.
doi: 10.1371/journal.pbio.0000059. Epub 2003 Oct 27.

Pten dose dictates cancer progression in the prostate

Affiliations

Pten dose dictates cancer progression in the prostate

Lloyd C Trotman et al. PLoS Biol. 2003 Dec.

Abstract

Complete inactivation of the PTEN tumor suppressor gene is extremely common in advanced cancer, including prostate cancer (CaP). However, one PTEN allele is already lost in the vast majority of CaPs at presentation. To determine the consequence of PTEN dose variations on cancer progression, we have generated by homologous recombination a hypomorphic Pten mouse mutant series with decreasing Pten activity: Pten(hy/+) > Pten(+/-) > Pten(hy/-) (mutants in which we have rescued the embryonic lethality due to complete Pten inactivation) > Pten prostate conditional knockout (Pten(pc)) mutants. In addition, we have generated and comparatively analyzed two distinct Pten(pc) mutants in which Pten is inactivated focally or throughout the entire prostatic epithelium. We find that the extent of Pten inactivation dictate in an exquisite dose-dependent fashion CaP progression, its incidence, latency, and biology. The dose of Pten affects key downstream _targets such as Akt, p27(Kip1), mTOR, and FOXO3. Our results provide conclusive genetic support for the notion that PTEN is haploinsufficient in tumor suppression and that its dose is a key determinant in cancer progression.


Conflict of interest statement

The authors have declared that no conflicts of interest exist.

Figures

Figure 1
Figure 1. Production and Analysis of a Pten Hypomorphic Mouse Series
(A) Schematic representation of the wild-type (+), hypomorphic (hy), and null (−) alleles of Pten. (For a detailed view, see Figure 3A.) (B) Breeding scheme used to produce a Pten hypomorphic mouse series and predicted hierarchy of Pten expression levels. (C) WB analysis of MEF lysates from ten littermate primary cell cultures obtained from a single cross (indicated in [B]) confirms predicted Pten expression hierarchy in the hypomorphic series and inversely related Akt phosphorylation status (top), both verified by densitometric analysis and plotting of the Pten/actin and phospho-Akt/Akt ratios (bottom). (D) MEF cDNA was amplified by semiquantitative PCR with exon 3 (forward) and exon 4–5 spanning (reverse) primers for Pten. Consistent with the concept of transcriptional interference at the Pten locus, Pten mRNA levels in Ptenhy/− MEFs are clearly below the level observed in heterozygosity. Lower panels show the quantification of Pten relative to Hprt amplification.
Figure 3
Figure 3. Conditional Knockout of the Pten Gene in Mouse Prostate
(A) Map of wild-type Pten locus (top), _targeting construct (second from top), predicted _targeted locus (third from top), Pten locus after Cre-mediated excision of the Neo resistance cassette by crossing with an EIIA-Cre mouse (fourth from top), and Pten locus after Cre-mediated excision of the floxed exons 4 and 5 by crossing with a PB-Cre or PB-Cre4 transgenic mouse (bottom). The genomic sequence is depicted as a black line, with black boxes representing exons 4 and 5. Pink and yellow boxes represent the Neo resistance and the HSV thymidine kinase cassette (TK) and light blue triangles represent the loxP site, respectively. The Pten genomic fragments used as a probe for Southern blot analysis are shown (3′ probe and probe 6.1). Solid arrows represent expected fragments following hybridization with the 3′ probe upon digestion with EcoRI, and dashed arrows represent expected fragments following hybridization with the probe 6.1 upon digestion with XbaI. Locations of PCR primers to detect wild-type, floxed allele (PtenloxP), and deleted allele are shown. XbaI (X), KpnI (K), BamHI (B), and EcoRI (E) sites are shown. (B) Genotyping of mice. Lanes 1 and 2 show Southern blot analysis of ES cell clones with 3′ probe of control (lanes 2) and recombined clones and #176 (lane 1) after digestion with EcoRI, showing a 6 kb wild-type band (WT) and a 2.5 kb _targeted band (R). Lanes 3 and 4 (control) represent Southern blot analysis of mouse tail DNA of offspring by crossing F1 mouse generated from #176 with an EIIA-Cre mouse with probe 6.1 after digestion with XbaI, showing wild-type, _targeted (PtenloxP-neo), and floxed (PtenloxP) locus bands. Lanes 5, 6 (control), and 7 represent Southern blot analysis of mouse tail DNA of offspring by crossing the mouse of lane 3 with a wild-type mouse with probe 6.1 after digestion with XbaI. Lanes 8–14 show PCR analysis of tail DNA of offspring by crossing a PB-Cre4 (+), PtenloxP/+ male with a PtenloxP/+ female with primers 1 and 2. Lanes 8, 9, and 14 indicate PtenloxP/+ , lanes 10 and 13 indicate Pten+/+,and lanes 11 and 12 indicate PtenloxP/loxP. Lanes 15–17 show PCR analysis of tail DNA of offspring by crossing a Ptenloxp/+ male with a PB-Cre4(+), PtenloxP/+ female with primers 1, 2, and 3. Lane 15 indicates PtenloxP/+, lane 16 indicates Pten+/+, and lane 17 indicates that the deleted allele exists in tail DNA of this offspring. (C) Representation of crossing scheme used to generate prostate-specific Pten conditional mutants. PtenloxP/loxP mutants were crossed with PB-Cre transgenic mice or PB-Cre4 transgenic mice.
Figure 2
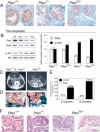
Figure 2. Ptenhy/− Mice Display Massive Hyperplasia and Invasive CaP
(A) IHC on preneoplastic anterior prostate (AP) tissue of 2-mo-old littermate mice shows decreasing Pten protein levels in the hypomorphic series. (B) WB analysis of the prostate lobes from (A) is shown on the left and their quantification is shown on the right. (C) MRI of Ptenhy/− mice aged 6–8 mo shows pathologic structures (encircled by dashed lines) adjacent to seminal vesicles (SV) coinciding with displacement of the bladder (Bl), features typically associated with massive prostate tumors (right). These features were never found in Pten+/+ or Pten+/− mice (left). (D) Macroscopic view of the Ptenhy/− mouse from (C) confirms massive enlargement of the AP lobes, but normal-sized seminal vesicles. (E) Quantification of WB analysis on AP lobe total lysates from the Ptenhy/− animal shown in (C) compared to preneoplastic AP of same genotype from (A) and (B), labeled 8 mo and 2 mo, respectively. Note that in the enlarged hyperplastic prostate, Pten protein expression is retained (levels are expressed relative to the corresponding wild-type animals). (F) Histopathology (H&E) of AP lesions at 8 mo reveals transition from low- to high-grade PIN and invasion (infiltration of stromal tissue is indicated by arrows) in Ptenhy/−, while age-matched Pten+/− tissue only shows hyperplastic features and Pten+/+ tissue is unaffected. Bars are 50 μm.
Figure 5
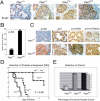
Figure 5. Molecular Effects of Loss of Pten and Biological Comparison of All Generated Mouse Models
(A) Ki-67 staining of AP lobe sections illustrates increasing proliferation with decreasing Pten levels (numbers are Ki-67-positive cells per 300 cells counted in percent; bars are 50 μm). (B) The phospho-Akt/Akt ratio is sharply increased in the prostates of 10-wk-old Ptenpc2 animals, as shown by densitometric quantification of WB analysis. (C) AP staining with anti-phospho-Akt antibodies reveals strong plasma membrane localization of phospho-Akt and apparent reduction of p27 protein detection, whereas phospho-mTOR and phospho-threonine-FOXO3 antibodies show increased staining in Ptenpc2 versus wild-type mouse prostates. Bars are 50 μm. (D) Kaplan–Meier curve showing prostate enlargement as visualized by MRI. Progressive rates of mass increase for Ptenpc2 (median age, 4 mo), Ptenhy/− (median age, 7 mo), and Ptenpc1 (median age, 16 mo) mice are found. In contrast, no prostatic size irregularities were detected in Pten+/+ or Pten+/− mice. (E) Incidence of invasive CaP. Invasive CaP was defined as tumor cells disrupting the basal membrane of prostatic glands and growing into the surrounding stroma. Full penetrance was observed in both Ptenpc1 mice as well as in Ptenpc2 mice. In contrast, Ptenhy/− mice with a follow-up of more than 6 mo displayed only 25% incidence of invasive CaP.
Figure 4
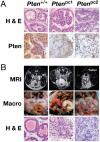
Figure 4. Ptenpc2 Mice Develop Invasive CaP
(A) Histopathology analysis of wild-type, Ptenpc1, and Ptenpc2 mice prior to tumor onset. H&E-stained AP (top) shows the difference in both the morphology and proliferative rates of the prostatic epithelium in these two models. IHC staining with anti-Pten antibody (bottom) was carried out on wild-type, Ptenpc1, and Ptenpc2 mice. In wild-type mice, strong cytoplasmic staining was observed in epithelial cells (arrowheads). In Ptenpc1 mice, staining was generally weak, whereas in Ptenpc2 mice, staining was completely absent in the prostatic epithelium. Original magnification, 400×. (B) MRI (top) shows massive prostate tumor (surrounded by dashed line) in Ptenpc2 mice (at 6 mo) and no detectable difference between the prostates of Ptenpc1 or Pten+/+ mice (at 12 mo; arrowheads). Bladder (Bl) and seminal vesicles (SV) are indicated. Macroscopic view (second from top) of the same animals confirms massive enlargement of both APs in Ptenpc2 and reveals the slightly enlarged AP of Ptenpc1 mice (encircled). H&E staining (bottom) of the prostate from Ptenpc1 mice was characterized by multiple foci of PIN lesions and by the presence of prostatic adenocarcinoma. These lesions contained well-differentiated neoplastic cells and showed focal areas of invasion (arrowheads). H&E stainings of prostates from Ptenpc2 mice showed diffuse, invasive CaP with large, undifferentiated tumor cells growing into stromal areas.
Figure 6
Figure 6. Pten Dose Affects Prostate Tumor Progression
Pten+/− mice develop hyperplasia, dysplasia, and low-grade PIN. Ptenhy/− mice develop at complete penetrance high-grade PIN at a young age (8–10 wk) and roughly 25% present invasive CaP around 8 mo. Ptenpc mice develop invasive CaP at complete penetrance. (See Discussion for a detailed description.) p27Kip1−/− mice, on the contrary, develop only BPH. Possibilities for human therapeutic intervention derived from our findings: in addition to inactivation of PI3K/AKT and mTOR enzymatic activities (in PTEN loss of heterozygosity condition), monitoring and elevation of PTEN expression levels of the remaining allele could not only prevent formation of PIN lesions (in PTEN+/− individuals), but could importantly also be used to counteract the progression to invasive phenotypes (as observed in Ptenhy/−mouse mutants).

Similar articles

Cited by

References

    1. Abate-Shen C, Banach-Petrosky WA, Sun X, Economides KD, Desai N, et al. Nkx3.1: Pten mutant mice develop invasive prostate adenocarcinoma and lymph node metastases. Cancer Res. 2003;63:3886–3890. - PubMed
    1. Backman S, Stambolic V, Mak T. PTEN function in mammalian cell size regulation. Curr Opin Neurobiol. 2002;12:516–522. - PubMed
    1. Brunet A, Bonni A, Zigmond MJ, Lin MZ, Juo P, et al. Akt promotes cell survival by phosphorylating and inhibiting a Forkhead transcription factor. Cell. 1999;96:857–868. - PubMed
    1. Cantley LC, Neel BG. New insights into tumor suppression: PTEN suppresses tumor formation by restraining the phosphoinositide 3-kinase/AKT pathway. Proc Natl Acad Sci U S A. 1999;96:4240–4245. - PMC - PubMed
    1. Cordon-Cardo C, Koff A, Drobnjak M, Capodieci P, Osman I, et al. Distinct altered patterns of p27KIP1 gene expression in benign prostatic hyperplasia and prostatic carcinoma. J Natl Cancer Inst. 1998;90:1284–1291. - PubMed

Publication types

MeSH terms

  NODES
Note 1
twitter 2