Effect of agonal and postmortem factors on gene expression profile: quality control in microarray analyses of postmortem human brain
- PMID: 14960286
- PMCID: PMC3098566
- DOI: 10.1016/j.biopsych.2003.10.013
Effect of agonal and postmortem factors on gene expression profile: quality control in microarray analyses of postmortem human brain
Abstract
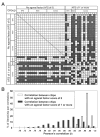
There are major concerns that specific agonal conditions, including coma and hypoxia, might affect ribonucleic acid (RNA) integrity in postmortem brain studies. We report that agonal factors significantly affect RNA integrity and have a major impact on gene expression profiles in microarrays. In contrast to agonal factors, gender, age, and postmortem factors have less effect on gene expression profiles. The Average Correlation Index is proposed as a method for evaluating RNA integrity on the basis of similarity of microarray profiles. Reducing the variance due to agonal factors is critical in investigating small but validated gene expression differences in messenger RNA levels between psychiatric patients and control subjects.
Figures


Similar articles
-
Methodological considerations for gene expression profiling of human brain.J Neurosci Methods. 2007 Jul 30;163(2):295-309. doi: 10.1016/j.jneumeth.2007.03.022. Epub 2007 Apr 8. J Neurosci Methods. 2007. PMID: 17512057 Free PMC article.
-
Quality control for microarray analysis of human brain samples: The impact of postmortem factors, RNA characteristics, and histopathology.J Neurosci Methods. 2007 Sep 30;165(2):198-209. doi: 10.1016/j.jneumeth.2007.06.001. Epub 2007 Jun 7. J Neurosci Methods. 2007. PMID: 17628689
-
Application and optimization of microarray technologies for human postmortem brain studies.Biol Psychiatry. 2004 Feb 15;55(4):329-36. doi: 10.1016/j.biopsych.2003.10.016. Biol Psychiatry. 2004. PMID: 14960284
-
DNA microarray analysis of postmortem brain tissue.Int Rev Neurobiol. 2004;60:153-81. doi: 10.1016/S0074-7742(04)60006-7. Int Rev Neurobiol. 2004. PMID: 15474590 Review. No abstract available.
-
Pre- and postmortem influences on brain RNA.J Neurochem. 1993 Jul;61(1):1-11. doi: 10.1111/j.1471-4159.1993.tb03532.x. J Neurochem. 1993. PMID: 7685811 Review.
Cited by
-
Gene expression studies in Depression development and treatment: an overview of the underlying molecular mechanisms and biological processes to identify biomarkers.Transl Psychiatry. 2021 Jun 8;11(1):354. doi: 10.1038/s41398-021-01469-6. Transl Psychiatry. 2021. PMID: 34103475 Free PMC article. Review.
-
Sample matching by inferred agonal stress in gene expression analyses of the brain.BMC Genomics. 2007 Sep 24;8:336. doi: 10.1186/1471-2164-8-336. BMC Genomics. 2007. PMID: 17892578 Free PMC article.
-
Mitochondrial dysfunction as the molecular basis of bipolar disorder: therapeutic implications.CNS Drugs. 2007;21(1):1-11. doi: 10.2165/00023210-200721010-00001. CNS Drugs. 2007. PMID: 17190525 Review.
-
The Role of N-Methyl-D-Aspartate Receptor Neurotransmission and Precision Medicine in Behavioral and Psychological Symptoms of Dementia.Front Pharmacol. 2019 May 22;10:540. doi: 10.3389/fphar.2019.00540. eCollection 2019. Front Pharmacol. 2019. PMID: 31191302 Free PMC article. Review.
-
The Department of Veterans Affairs Gulf War Veterans' Illnesses Biorepository: Supporting Research on Gulf War Veterans' Illnesses.Brain Sci. 2021 Oct 14;11(10):1349. doi: 10.3390/brainsci11101349. Brain Sci. 2021. PMID: 34679413 Free PMC article.
References
-
- Albrecht J, Yanagihara T. Effect of anoxia and ischemia on ribonuclease activity in brain. J Neurochem. 1979;32:1131–1133. - PubMed
-
- Bahn S, Augood SJ, Ryan M, Standaert DG, Starkey M, Emson PC. Gene expression profiling in the post-mortem human brain—no cause for dismay. J Chem Neuroanat. 2001;22:79–94. - PubMed
-
- Barton AJ, Pearson RC, Najlerahim A, Harrison PJ. Pre- and postmortem influences on brain RNA. J Neurochem. 1993;61:1–11. - PubMed
-
- Bunney WE, Bunney BG, Vawter MP, Tomita H, Li J, Evans SJ, et al. Microarray technology: A review of new strategies to discover candidate vulnerability genes in psychiatric disorders. Am J Psychiatry. 2003;160:657–666. - PubMed
-
- Burke WJ, O’Malley KL, Chung HD, Harmon SK, Miller JP, Berg L. Effect of pre- and postmortem variables on specific mRNA levels in human brain. Brain Res Mol Brain Res. 1991;11:37–41. - PubMed
Publication types
MeSH terms
Substances
Grants and funding
LinkOut - more resources
Full Text Sources
Other Literature Sources
Miscellaneous

