Local and systemic insulin resistance resulting from hepatic activation of IKK-beta and NF-kappaB
- PMID: 15685173
- PMCID: PMC1440292
- DOI: 10.1038/nm1166
Local and systemic insulin resistance resulting from hepatic activation of IKK-beta and NF-kappaB
Abstract
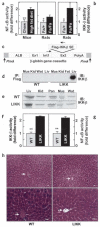
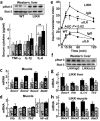
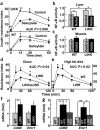
We show that NF-kappaB and transcriptional _targets are activated in liver by obesity and high-fat diet (HFD). We have matched this state of chronic, subacute 'inflammation' by low-level activation of NF-kappaB in the liver of transgenic mice, designated LIKK, by selectively expressing constitutively active IKK-b in hepatocytes. These mice exhibit a type 2 diabetes phenotype, characterized by hyperglycemia, profound hepatic insulin resistance, and moderate systemic insulin resistance, including effects in muscle. The hepatic production of proinflammatory cytokines, including IL-6, IL-1beta and TNF-alpha, was increased in LIKK mice to a similar extent as induced by HFD in in wild-type mice. Parallel increases were observed in cytokine signaling in liver and mucscle of LIKK mice. Insulin resistance was improved by systemic neutralization of IL-6 or salicylate inhibition of IKK-beta. Hepatic expression of the IkappaBalpha superrepressor (LISR) reversed the phenotype of both LIKK mice and wild-type mice fed an HFD. These findings indicate that lipid accumulation in the liver leads to subacute hepatic 'inflammation' through NF-kappaB activation and downstream cytokine production. This causes insulin resistance both locally in liver and systemically.
Figures


Similar articles
-
IKK-beta links inflammation to obesity-induced insulin resistance.Nat Med. 2005 Feb;11(2):191-8. doi: 10.1038/nm1185. Epub 2005 Jan 30. Nat Med. 2005. PMID: 15685170
-
Interferon regulatory factor 3 constrains IKKβ/NF-κB signaling to alleviate hepatic steatosis and insulin resistance.Hepatology. 2014 Mar;59(3):870-85. doi: 10.1002/hep.26751. Epub 2014 Jan 30. Hepatology. 2014. PMID: 24123166
-
Inflammation and the IKK beta/I kappa B/NF-kappa B axis in obesity- and diet-induced insulin resistance.Int J Obes Relat Metab Disord. 2003 Dec;27 Suppl 3:S49-52. doi: 10.1038/sj.ijo.0802501. Int J Obes Relat Metab Disord. 2003. PMID: 14704745 Review.
-
Sulfasalazine and BAY 11-7082 interfere with the nuclear factor-kappa B and I kappa B kinase pathway to regulate the release of proinflammatory cytokines from human adipose tissue and skeletal muscle in vitro.Endocrinology. 2005 Mar;146(3):1491-7. doi: 10.1210/en.2004-0809. Epub 2004 Nov 24. Endocrinology. 2005. PMID: 15564333
-
Recent advances in the relationship between obesity, inflammation, and insulin resistance.Eur Cytokine Netw. 2006 Mar;17(1):4-12. Eur Cytokine Netw. 2006. PMID: 16613757 Review.
Cited by
-
Metabolic syndrome and insulin resistance: underlying causes and modification by exercise training.Compr Physiol. 2013 Jan;3(1):1-58. doi: 10.1002/cphy.c110062. Compr Physiol. 2013. PMID: 23720280 Free PMC article. Review.
-
Role of transcription factor modifications in the pathogenesis of insulin resistance.Exp Diabetes Res. 2012;2012:716425. doi: 10.1155/2012/716425. Epub 2011 Oct 26. Exp Diabetes Res. 2012. PMID: 22110478 Free PMC article. Review.
-
Glucagon-like peptide-1 inhibits adipose tissue macrophage infiltration and inflammation in an obese mouse model of diabetes.Diabetologia. 2012 Sep;55(9):2456-68. doi: 10.1007/s00125-012-2592-3. Epub 2012 Jun 22. Diabetologia. 2012. PMID: 22722451
-
Immunomodulatory glycan LNFPIII alleviates hepatosteatosis and insulin resistance through direct and indirect control of metabolic pathways.Nat Med. 2012 Nov;18(11):1665-72. doi: 10.1038/nm.2962. Epub 2012 Oct 28. Nat Med. 2012. PMID: 23104131 Free PMC article.
-
Effect of Chronic Pioglitazone Treatment on Hepatic Gene Expression Profile in Obese C57BL/6J Mice.Int J Mol Sci. 2015 May 29;16(6):12213-29. doi: 10.3390/ijms160612213. Int J Mol Sci. 2015. PMID: 26035752 Free PMC article.
References
-
- Mokdad AH, et al. Prevalence of obesity, diabetes, and obesity-related health risk factors, 2001. JAMA. 2003;289:76–79. - PubMed
-
- National Diabetes Data Group . Diabetes in America. 2nd National Institutes of Diabetes and Digestive Diseases, National Institutes of Health; Bethesda, Maryland: 1995.
-
- Boden G, Shulman GI. Free fatty acids in obesity and type 2 diabetes: defining their role in the development of insulin resistance and beta-cell dysfunction. Eur. J. Clin. Invest. 2002;32(Suppl 3):14–23. - PubMed
-
- Seppala-Lindroos A, et al. Fat accumulation in the liver is associated with defects in insulin suppression of glucose production and serum free fatty acids independent of obesity in normal men. J. Clin. Endocrinol. Metab. 2002;87:3023–3028. - PubMed
-
- Ryysy L, et al. Hepatic fat content and insulin action on free fatty acids and glucose metabolism rather than insulin absorption are associated with insulin requirements during insulin therapy in type 2 diabetic patients. Diabetes. 2000;49:749–758. - PubMed
Publication types
MeSH terms
Substances
Grants and funding
LinkOut - more resources
Full Text Sources
Other Literature Sources
Miscellaneous

