Early presynaptic and late postsynaptic components contribute independently to brain-derived neurotrophic factor-induced synaptic plasticity
- PMID: 15788764
- PMCID: PMC6725079
- DOI: 10.1523/JNEUROSCI.2970-04.2005
Early presynaptic and late postsynaptic components contribute independently to brain-derived neurotrophic factor-induced synaptic plasticity
Abstract
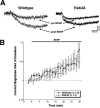
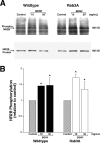
Trophin-induced synaptic plasticity consists of both presynaptic and postsynaptic processes. The potential interdependence of these mechanisms and their temporal relationships are undefined. The synaptic vesicle protein Rab3A is required for the early, initial 10 min phase but not for the later phase of BDNF-enhanced transmission. We now examine the temporal distinction and mechanistic relationships between these phases of BDNF action. Rab3A mutant cells did not exhibit increased miniature EPSC frequency in response to BDNF in cell culture, indicating an absence of the presynaptic component. In contrast, BDNF enhanced postsynaptic glutamate-induced current in the mutant neurons as in the wild type, indicating that the postsynaptic component of the response was intact. Finally, the postsynaptic NMDA receptor subunit NR2B was phosphorylated at Tyr1472 by BDNF in Rab3A knock-outs, as shown previously in wild type. Our results are the first to demonstrate that presynaptic and postsynaptic components of BDNF-enhanced synaptic activity are independent and temporally distinct.
Figures


Similar articles
-
Rab3A is required for brain-derived neurotrophic factor-induced synaptic plasticity: transcriptional analysis at the population and single-cell levels.J Neurosci. 2001 Sep 1;21(17):6782-90. doi: 10.1523/JNEUROSCI.21-17-06782.2001. J Neurosci. 2001. PMID: 11517266 Free PMC article.
-
Presynaptic and postsynaptic NMDA receptors mediate distinct effects of brain-derived neurotrophic factor on synaptic transmission.J Neurophysiol. 2008 Dec;100(6):3175-84. doi: 10.1152/jn.90880.2008. Epub 2008 Oct 15. J Neurophysiol. 2008. PMID: 18922945 Free PMC article.
-
Activity- and BDNF-induced plasticity of miniature synaptic currents in ES cell-derived neurons integrated in a neocortical network.J Neurophysiol. 2005 Dec;94(6):4538-43. doi: 10.1152/jn.00155.2005. J Neurophysiol. 2005. PMID: 16293594
-
Brain-derived neurotrophic factor-induced regulation of RNA metabolism in neuronal development and synaptic plasticity.Wiley Interdiscip Rev RNA. 2022 Sep;13(5):e1713. doi: 10.1002/wrna.1713. Epub 2022 Jan 24. Wiley Interdiscip Rev RNA. 2022. PMID: 35075821 Review.
-
BDNF as an anterophin; a novel neurotrophic relationship between brain neurons.Trends Neurosci. 2001 Dec;24(12):683-4; discussion 684-5. doi: 10.1016/s0166-2236(00)01955-x. Trends Neurosci. 2001. PMID: 11718853 Review.
Cited by
-
The neuropeptide VGF produces antidepressant-like behavioral effects and enhances proliferation in the hippocampus.J Neurosci. 2007 Nov 7;27(45):12156-67. doi: 10.1523/JNEUROSCI.1898-07.2007. J Neurosci. 2007. PMID: 17989282 Free PMC article.
-
Brain-derived neurotrophic factor-tyrosine kinase B pathway mediates NMDA receptor NR2B subunit phosphorylation in the supraoptic nuclei following progressive dehydration.J Neuroendocrinol. 2011 Oct;23(10):894-905. doi: 10.1111/j.1365-2826.2011.02209.x. J Neuroendocrinol. 2011. PMID: 21848649 Free PMC article.
-
BDNF increases release probability and the size of a rapidly recycling vesicle pool within rat hippocampal excitatory synapses.J Physiol. 2006 Aug 1;574(Pt 3):787-803. doi: 10.1113/jphysiol.2006.111310. Epub 2006 May 18. J Physiol. 2006. PMID: 16709633 Free PMC article.
-
The BDNF Val66Met polymorphism enhances glutamatergic transmission but diminishes activity-dependent synaptic plasticity in the dorsolateral striatum.Neuropharmacology. 2017 Jan;112(Pt A):84-93. doi: 10.1016/j.neuropharm.2016.06.030. Epub 2016 Jul 1. Neuropharmacology. 2017. PMID: 27378336 Free PMC article.
-
BDNF Activates Postsynaptic TrkB Receptors to Induce Endocannabinoid Release and Inhibit Presynaptic Calcium Influx at a Calyx-Type Synapse.J Neurosci. 2020 Oct 14;40(42):8070-8087. doi: 10.1523/JNEUROSCI.2838-19.2020. Epub 2020 Sep 18. J Neurosci. 2020. PMID: 32948677 Free PMC article.
References
-
- Bean AJ, Scheller RH (1997) Better late than never: a role for rabs late in exocytosis. Neuron 19: 751-754. - PubMed
-
- Castillo PE, Janz R, Sudhof TC, Tzounopoulos T, Malenka RC, Nicoll RA (1997) Rab3A is essential for mossy fibre long-term potentiation in the hippocampus. Nature 388: 590-593. - PubMed
-
- Geppert M, Bolshakov VY, Siegelbaum SA, Takei K, De Camilli P, Hammer RE, Sudhof TC (1994) The role of Rab3A in neurotransmitter release. Nature 369: 493-497. - PubMed
Publication types
MeSH terms
Substances
Grants and funding
LinkOut - more resources
Full Text Sources
