Comparative Study
. 2005 Sep 5;202(5):673-85.
doi: 10.1084/jem.20050882.

Broadly _targeted human cytomegalovirus-specific CD4+ and CD8+ T cells dominate the memory compartments of exposed subjects

Affiliations
Comparative Study

Broadly _targeted human cytomegalovirus-specific CD4+ and CD8+ T cells dominate the memory compartments of exposed subjects

Andrew W Sylwester et al. J Exp Med. .

Abstract

Human cytomegalovirus (HCMV) infections of immunocompetent hosts are characterized by a dynamic, life-long interaction in which host immune responses, particularly of T cells, restrain viral replication and prevent disease but do not eliminate the virus or preclude transmission. Because HCMV is among the largest and most complex of known viruses, the T cell resources committed to maintaining this balance have never been characterized completely. Here, using cytokine flow cytometry and 13,687 overlapping 15mer peptides comprising 213 HCMV open reading frames (ORFs), we found that 151 HCMV ORFs were immunogenic for CD4(+) and/or CD8(+) T cells, and that ORF immunogenicity was influenced only modestly by ORF expression kinetics and function. We further documented that total HCMV-specific T cell responses in seropositive subjects were enormous, comprising on average approximately 10% of both the CD4(+) and CD8(+) memory compartments in blood, whereas cross-reactive recognition of HCMV proteins in seronegative individuals was limited to CD8(+) T cells and was rare. These data provide the first glimpse of the total human T cell response to a complex infectious agent and will provide insight into the rules governing immunodominance and cross-reactivity in complex viral infections of humans.


Figures
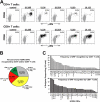
Figure 1.
Figure 1.
Identification of HCMV ORF–specific CD4+ and CD8+ T cell responses in HCMV-seropositive adults. (A) PBMCs from HCMV-seropositive subject P6 were stimulated with costimulation plus mixtures of consecutive, overlapping 15mer peptides comprising complete HCMV ORFs (UL36, UL83, and UL122) or large ORF fragments (UL32B, UL55A) or with costimulation alone (negative control) and then were examined by CFC for their correlated expression of surface CD3 and CD4 and intracellular CD69 and γ-IFN. The profiles shown were gated on CD3+/CD4+ small lymphocytes (CD4+ T cells) or CD3+/CD4 small lymphocytes (CD8+ T cells), with the responding (CD69+/γ-IFN+) T cells depicted in bold (% in upper right corner of each profile) and the nonresponding T cells in gray. The results shown are typical of seropositive donors in which certain ORFs generated clusters of responding cells over and above the spontaneous activation noted in controls. (B) The pie chart shows the fraction of the tested 213 HCMV ORFs that are able to stimulate at least one positive CD4+ and/or CD8+ T cell response (as defined in Materials and methods) in 33 HCMV-seropositive donors. (C) The number of times that each HCMV ORF is recognized by CD4+ T cells (top) or CD8+ T cells (bottom) in the 33 HCMV-seropositive donors is shown, from the most to least frequently recognized (note: the CD4 and CD8 analyses are independent, reflecting all the responses of a given lineage, irrespective of the response of the other lineage).
Figure 2.
Figure 2.
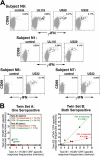
T cell recognition of HCMV ORFs in HCMV-seronegative subjects and in identical twins that are concordant or discordant for HCMV seroreactivity. (A) CFC was used to assess the CD4+ and CD8+ T cell responses of 10 HCMV-seronegative donors to 15mer peptide mixes encompassing all 213 HCMV ORFs. The figure demonstrates the 7 assays of 4,640 total performed on these subjects (2,320 each for CD4+ and CD8+ T cell responses)—all CD8+—that gave reproducible clusters of responding cells that were clearly distinct from background (n = 3 for all seven responses, including at least one repeat with CD3+/CD8+ gating). (B) Two sets of identical twins, one (Twin Set A) discordant for HCMV seroreactivity, the other (Twin Set B) concordant positive, were evaluated for peripheral blood CD4+ and CD8+ T cell responses to 213 HCMV ORFs by CFC. The figure shows all identified responses (CD4+ T cell responses in red; CD8+ T cell responses in green), presented as memory-corrected response frequencies. The two responses (UL116 and US29) of the seronegative twin of set A (subject N1) were two of the seven cross-reactive responses noted in Fig. 2 A.
Figure 3.
Figure 3.
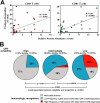
Determinants of T cell recognition of HCMV ORFs: abundance of ORF products in virions and ORF variability among different HCMV strains. (A) The relative abundance of the 25 HCMV proteins found in highly purified HCMV virions, as determined by proteomic analysis (22), is plotted against the frequency of recognition of the corresponding ORF peptide mixes by CD4+ and CD8+ T cells in the cohort of 33 HCMV- seropositive donors. Note that although virion protein abundance correlates positively with both CD4+ and CD8+ ORF recognition frequencies, the strength (correlation coefficient, R) and statistical significance (p-value) of this association is considerably stronger for CD8+ T cell responses. (B) To determine the impact of HCMV ORF sequence variability on the measurement of T cell immunogenicity of these ORFs, we compared sequence information for the 160 HCMV ORFs that have been sequenced in six different HCMV strains (AD169, Toledo, Towne, FIX, PH, and TR) and divided these ORFs into three categories: high variability (<80% amino acid identity; 13 ORFs), intermediate variability (80–95% identity; 36 ORFs), and low variability (>95% identity, 111 ORFs). The pie charts show the relative fraction of the ORFs within each of these categories that are frequently recognized by either CD4+ or CD8+ T cells or both (>4/33 donors; red), infrequently recognized (1–4 donors; blue), or not recognized at all (gray). The statistical significance of the differences in frequency of T cell recognition among three groups of ORFs (high, intermediate, and low variability) was determined by chi square analysis with the p-values between each pair of groups shown. The p-value for the overall strength of the association between ORF amino acid sequence variability and T cell recognition frequencies was <0.0001.
Figure 4.
Figure 4.
Characterization of total HCMV-specific T cell responses in seropositive subjects. (A) For each seropositive and seronegative donor, all positive peripheral blood responses to 213 HCMV ORFs were summed (Σ response frequencies) to determine the total HCMV-specific response within the overall or memory CD4+ and CD8+ peripheral blood T cell populations. The horizontal lines and accompanying arrows and percentages indicate the median total response for the 10 seronegative or 33 seropositive donors. Note that the total Σ HCMV CD4+ T cell responses was zero for all 10 seronegative donors. As indicated in Fig. 2, the total Σ HCMV CD8+ T cell responses was positive for 4/10 donors, but the median of this distribution remained zero. (B) The number of ORFs recognized by the CD4+ or CD8+ T cells of each HCMV-seropositive donor is shown. The horizontal line indicates the median value of the overall population of 33 donors. (C) For each HCMV-seropositive individual, the total HCMV ORF–specific CD4+ or CD8+ T cell responses in the memory compartment (Σ response frequencies) were divided by the number of responses contributing to that total to arrive at the average size of HCMV ORF–specific responses in each donor (as a fraction of the peripheral blood memory population). The figure shows the distribution of these average sizes with the horizontal line indicating the median value of the overall population of 33 seropositive donors. (D) The figure shows the average size (±SEM) of the memory-corrected CD4+ or CD8+ T cell response to each individual ORF in the individuals that manifested a positive response to that ORF. Only ORFs with responses in at least 4 of 33 donors are shown in descending order with respect to ORF recognition frequency (see Fig. 1).
Figure 5.
Figure 5.
Modeling of the total HCMV-specific T cell response for practical clinical evaluation. (A–C) To ascertain a practical surrogate for the Σ response frequencies to 213 HCMV ORFs, we rank ordered the HCMV ORFs by their total response in the 33 seropositive donors (e.g., Σ response frequencies in the overall cohort; see Table S3 for ranking) and then performed linear regression analysis comparing the Σ response frequencies of the 213 HCMV ORFs with the Σ response frequencies of the top 1 ORF, the top 2 ORFs, the top 3, top 4, and so on. The x-axis of these graphs indicates the increasing number of ORFs added to each analysis (of 213 total, only 1–50 are shown). In plot A, the number of peptides added to the analysis with each added ORF is shown (of 13,687 total). Plot B shows the slope of the regression line as a function of increasing ORFs. Plot D shows the relationship between increasing ORFs and the Pearson correlation coefficient. The dotted lines in plot D indicate the minimum number of ORFs required to achieve a correlation coefficient of 0.9; in plots A and B, the corresponding number of peptides and regression slope are indicated. (D and E) Regression analysis comparing Σ response frequencies using 213 HCMV ORFs with the Σ response frequencies of the top 15 ORFs for CD8+ responses and the top 6 ORFs for CD4+ responses. (F) Regression analysis comparing Σ CD4+ response frequencies using all 213 HCMV ORFs with the CD4+ response frequencies obtained using whole HCMV lysates as the stimulating antigen.

Similar articles

Cited by

References

    1. Mocarski, E.S., Jr., and C.T. Courcelle. 2001. Cytomegaloviruses and their replication. Fields Virology. D.M. Knipe and P.M. Howley, editors. Lippincott Williams & Wilkins, Philadelphia. 2629–2674.
    1. Pass, R.F. 2001. Cytomegalovirus. Fields Virology. D.M. Knipe and P.M. Howley, editors. Lippincott Williams & Wilkins, Philadelphia. 2675–2706.
    1. Greenberg, P.D., and S.R. Riddell. 1999. Deficient cellular immunity—finding and fixing the defects. Science. 285:546–551. - PubMed
    1. Reddehase, M.J. 2002. Antigens and immunoevasins: opponents in cytomegalovirus immune surveillance. Nat. Rev. Immunol. 2:831–844. - PubMed
    1. Einsele, H., E. Roosnek, N. Rufer, C. Sinzger, S. Riegler, J. Loffler, U. Grigoleit, A. Moris, H.G. Rammensee, L. Kanz, A. Kleihauer, F. Frank, G. Jahn, and H. Hebart. 2002. Infusion of cytomegalovirus (CMV)-specific T cells for the treatment of CMV infection not responding to antiviral chemotherapy. Blood. 99:3916–3922. - PubMed

Publication types

  NODES
Association 3
Note 5
twitter 2