. 2005 Dec;3(12):e402.
doi: 10.1371/journal.pbio.0030402. Epub 2005 Nov 15.

Theta rhythms coordinate hippocampal-prefrontal interactions in a spatial memory task

Affiliations

Theta rhythms coordinate hippocampal-prefrontal interactions in a spatial memory task

Matthew W Jones et al. PLoS Biol. 2005 Dec.

Abstract

Decision-making requires the coordinated activity of diverse brain structures. For example, in maze-based tasks, the prefrontal cortex must integrate spatial information encoded in the hippocampus with mnemonic information concerning route and task rules in order to direct behavior appropriately. Using simultaneous tetrode recordings from CA1 of the rat hippocampus and medial prefrontal cortex, we show that correlated firing in the two structures is selectively enhanced during behavior that recruits spatial working memory, allowing the integration of hippocampal spatial information into a broader, decision-making network. The increased correlations are paralleled by enhanced coupling of the two structures in the 4- to 12-Hz theta-frequency range. Thus the coordination of theta rhythms may constitute a general mechanism through which the relative timing of disparate neural activities can be controlled, allowing specialized brain structures to both encode information independently and to interact selectively according to current behavioral demands.


Figures

Figure 1
Figure 1. Experimental Design and Performance during the Spatial Working-Memory Task
(A) Schematic of the maze and a pair of runs comprising a single trial (forced-turn direction C2 to F1, solid arrow; choice direction F1 to C1, dotted arrow). Grey rectangle marks the moveable barrier. (B) The task was broken down into distinct behavioral stages for analysis: 1, running away from the “cue” reward point towards the central arm; 2, crossing the central arm in the choice direction (only activity on the central three-quarters section of the arm was considered for analysis to avoid divergent routes near the turning points and inconsistent running behavior); 3, post-choice running to reward point (rats were rewarded for choosing C1 if the trial started at F1 and for choosing C2 if the trial started at F2); 4, returning to the central arm (where a second barrier blocked the route to the opposite reward point); 5, crossing the central arm in the “forced-turn” direction; and 6, returning to one of the two reward points (F1 or F2 chosen at random for each trial). Stages 1 and 2, marked by the red arrows, were presumed to involve working memory and/or decision-making. (C) The six rats were trained to asymptotic working-memory performance for at least 12 d before tetrode implantation.
Figure 2
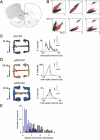
Figure 2. Recording Details and Typical Hippocampal and Prefrontal Firing Properties on the Maze
(A) mPFC tetrodes _targeted deep layers of prelimbic and infralimbic cortices. Photograph shows a typical lesion site (triangle) marking the tip of a tetrode. The partial brain section is superimposed on a schematic of a coronal section taken 3.7 mm rostral of bregma, showing the boundary of the prelimbic cortex (denoted by PrL). (B) Spike amplitude clusters for a typical mPFC tetrode. The cluster in red was for the neuron shown in D. The points in the six panels plot extracellular-action-potential amplitude on wire 1 of the tetrode versus wire 2, wire 1 versus wire 3, etc. (C) and (D) Activities of a typical CA1 place cell and two mPFC pyramidal cells, respectively (see also Figure S2). The upper mPFC neuron in D was recorded simultaneously with the CA1 neuron in C. Spikes were binned into positional pixels, and mean pixel firing rate was color-coded to generate the firing-rate maps on the left. Graphs show corresponding inter-spike interval distributions (10 Hz marked by the blue line; note logarithmic time scale). Waveforms show averaged extracellular action potentials recorded on a single wire of each tetrode (horizontal and vertical scale bars, 1 ms and 400 μV, respectively). (E) Overlap in the distributions of spatial information carried by spikes from CA1 (black) and mPFC (blue) populations.
Figure 3
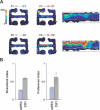
Figure 3. Directional Bias of mPFC and CA1 Firing Rates
(A) Firing rate of a single mPFC neuron split into four trial types (shown by arrows). This neuron tended to fire at higher rates during runs in the choice direction, with the central arm firing highest during F2 → C2 trials. The magnified boxes show the central three-quarters section of the central arm. White lines mark the boundary of the positional pixels traversed by the rat on F1 → C1 trials. These are superimposed on the firing-rate map for F2 → C2 trials, showing the overlap between positions visited on both trial types. (B) Central-arm firing rates of both mPFC (blue) and CA1 (black) neurons tended to distinguish between runs in the forced-turn and choice directions (directional index > 0) and choice-direction runs in either F1 → C1 or F2 → C2 trials (preference index > 0; see Results). However, there was no overall tendency for CA1 or mPFC populations to fire at higher rates during any one epoch or trial type.
Figure 4
Figure 4. Enhanced Cross-Correlations between Spike Trains of CA1–mPFC Neuron Pairs during Behavioral Epochs Requiring Working Memory and Decision-Making
(A) Mean running speeds, CA1 firing rates, and mPFC firing rates were comparable during forced-turn (grey, epoch 5), choice-correct (red, epoch 2), and choice-error runs (hatched red) across the central arm. (B) Example cross-correlogram (bin size 10 ms, maximum time lag ± 1,000 ms) for a single CA1–mPFC neuron pair (referenced to the CA1 firing at time 0), showing that correlated activity was higher during choice runs (red) than forced-turn runs (grey). The width of the central peak at 50% of its maximum value is 120 ms. This compares with a mean peak width of 156 ± 41 ms for 29 neuron pairs with peak cross-correlation coefficients (bin size 10 ms) of at least 0.0005. For comparison across task epochs, peak cross-correlation coefficients were quantified at the ± 200-ms time range with a bin size of 100 ms (inset to the right). (C) Mean correlations for all neuron pairs that fired at least 50 spikes each during the three run types. CA1–mPFC correlation coefficients were significantly higher during choice runs (72 pairs) than during forced-turn (72) or error runs (49 pairs; ** p < 0.01, * p < 0.05 Wilcoxon rank sum test for grouped animal means).
Figure 5
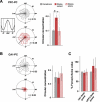
Figure 5. Spike-Timing in CA1 and mPFC Populations Was Phase-Locked to CA1 Theta Rhythm
Firing-rate maps for representative mPFC (A) and CA1 (B) pyramidal cells. Graphs show inter-spike interval distributions (blue line marks 10 Hz). Thick black lines show CA1 LFP band pass filtered at 4–12 Hz during single central-arm crossings (scale bar 0.5 mV, length 1.3 s and 1.4 s in A and B, respectively) with spike times of the two neurons above marked by ticks. Raw LFP is shown by the thin black line in A. Rose histograms show phase distributions for these single mPFC (blue) and CA1 (black) neurons with respect to CA1 theta rhythm. Thick black lines mark mean preferred phase. The numbers on the outer circular axis give spike counts. Circular-concentration coefficients are given by κ. Both distributions are significantly nonuniform (p < 0.01, Rayleigh test).
Figure 6
Figure 6. Theta Phase-Locking of mPFC Spike Timing to the CA1 Theta Rhythm Was Enhanced during Choice Epochs Relative to Forced-Turn and Choice-Error Runs
Phase distributions for single mPFC (A) and CA1 (B) neurons during forced-turn (grey), choice-direction (red), and choice-error (hatched red) epochs. Bar graphs show mean-population circular-concentration coefficients (κ) during the three epochs, and the significant (** p < 0.01, * p < 0.05) increase in κ for the mPFC population during choice epochs (39 neurons) relative to forced-turn and choice-error epochs (39 and 27 neurons, respectively). In contrast, the CA1 population showed a similar degree of phase-locking during all epoch types (for 26, 26, and 15 neurons, respectively). (C) The results in A cannot be explained by changes in mean LFP theta power, which was comparable during forced-turn, choice, and choice-error epochs in both CA1 and mPFC.
Figure 7
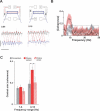
Figure 7. CA1–mPFC LFP Coherence Showed a Significant Peak in the Theta-Frequency Range and Was Enhanced during Choice Epochs
(A) Raw LFP from dorsal CA1 (black) and mPFC (blue) during consecutive single central-arm crossings in the choice (left) and forced-turn (right) directions. Thick lines show theta-filtered LFP. Horizontal scale bar 0.5 s; vertical scale bar 0.8 mV. Red lines highlight the timing relationship between CA1 and mPFC theta peaks (red circles). Numbers above raw LFP traces give coherence in the 4- to 12-Hz range during these two example trials. (B) Trial-averaged, central-arm coherence during a single run-session (17 trials). Central-arm coherence is subdivided into forced-turn (grey) and choice (red) directions. Dashed line marks 95% confidence level, with shaded band thickness corresponding to jackknife error bars (estimated over trials and nine tapers). Significant coherence was seen only in the theta-frequency range, and only during choice epochs on the central arm. (C) Mean coherence at delta (1–4 Hz) and theta (4–12 Hz) frequencies, pooled across animals during forced-turn (grey), choice-correct (red), and choice-error (hatched red) epochs (* p < 0.05). Like theta CA1–mPFC spike cross-correlations and theta phase-locking of mPFC units, theta-frequency CA1–mPFC LFP coherence peaked during choice-direction runs across the central arm.

Similar articles

Cited by

References

    1. Steriade M, Gloor P, Llinas RR, Lopes de Silva FH, Mesulam MM. Report of IFCN Committee on Basic Mechanisms. Basic mechanisms of cerebral rhythmic activities. Electroencephalogr Clin Neurophysiol. 1990;76:481–508. - PubMed
    1. Singer W. Neuronal synchrony: A versatile code for the definition of relations? Neuron. 1999;24:49–65. - PubMed
    1. Varela F, Lachaux JP, Rodriguez E, Martinerie J. The brainweb: Phase synchronization and large-scale integration. Nat Rev Neurosci. 2001;2:229–239. - PubMed
    1. Friston KJ, Frith CD. Schizophrenia: A disconnection syndrome? Clin Neurosci. 1995;3:89–97. - PubMed
    1. Spencer KM, Nestor PG, Niznikiewicz MA, Salisbury DF, Shenton ME, et al. Abnormal neural synchrony in schizophrenia. J Neurosci. 2003;23:7407–7411. - PMC - PubMed

Publication types

  NODES
Note 2
twitter 2