Cocaine-induced dendritic spine formation in D1 and D2 dopamine receptor-containing medium spiny neurons in nucleus accumbens
- PMID: 16492766
- PMCID: PMC1413917
- DOI: 10.1073/pnas.0511244103
Cocaine-induced dendritic spine formation in D1 and D2 dopamine receptor-containing medium spiny neurons in nucleus accumbens
Abstract
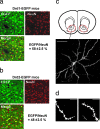
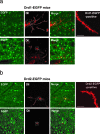
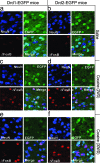
Psychostimulant-induced alteration of dendritic spines on dopaminoceptive neurons in nucleus accumbens (NAcc) has been hypothesized as an adaptive neuronal response that is linked to long-lasting addictive behaviors. NAcc is largely composed of two distinct subpopulations of medium-sized spiny neurons expressing high levels of either dopamine D1 or D2 receptors. In the present study, we analyzed dendritic spine density after chronic cocaine treatment in distinct D1 or D2 receptor-containing medium-sized spiny neurons in NAcc. These studies made use of transgenic mice that expressed EGFP under the control of either the D1 or D2 receptor promoter (Drd1-EGFP or Drd2-EGFP). After 28 days of cocaine treatment and 2 days of withdrawal, spine density increased in both Drd1-EGFP- and Drd2-EGFP-positive neurons. However, the increase in spine density was maintained only in Drd1-EGFP-positive neurons 30 days after drug withdrawal. Notably, increased DeltaFosB expression also was observed in Drd1-EGFP- and Drd2-EGFP-positive neurons after 2 days of drug withdrawal but only in Drd1-EGFP-positive neurons after 30 days of drug withdrawal. These results suggest that the increased spine density observed after chronic cocaine treatment is stable only in D1-receptor-containing neurons and that DeltaFosB expression is associated with the formation and/or the maintenance of dendritic spines in D1 as well as D2 receptor-containing neurons in NAcc.
Conflict of interest statement
Conflict of interest statement: No conflicts declared.
Figures


Similar articles
-
Acute binge pattern cocaine administration induces region-specific effects in D1-r- and D2-r-expressing cells in eGFP transgenic mice.Neuroscience. 2013 Dec 3;253:123-31. doi: 10.1016/j.neuroscience.2013.08.032. Epub 2013 Aug 31. Neuroscience. 2013. PMID: 24001687
-
Methylphenidate-induced dendritic spine formation and DeltaFosB expression in nucleus accumbens.Proc Natl Acad Sci U S A. 2009 Feb 24;106(8):2915-20. doi: 10.1073/pnas.0813179106. Epub 2009 Feb 6. Proc Natl Acad Sci U S A. 2009. PMID: 19202072 Free PMC article.
-
Stress and Cocaine Trigger Divergent and Cell Type-Specific Regulation of Synaptic Transmission at Single Spines in Nucleus Accumbens.Biol Psychiatry. 2016 Jun 1;79(11):898-905. doi: 10.1016/j.biopsych.2015.05.022. Epub 2015 Jun 6. Biol Psychiatry. 2016. PMID: 26164802 Free PMC article.
-
Licking microstructure in response to novel rewards, reward devaluation and dopamine antagonists: Possible role of D1 and D2 medium spiny neurons in the nucleus accumbens.Neurosci Biobehav Rev. 2024 Oct;165:105861. doi: 10.1016/j.neubiorev.2024.105861. Epub 2024 Aug 17. Neurosci Biobehav Rev. 2024. PMID: 39159734 Review.
-
Dyadic social interaction inhibits cocaine-conditioned place preference and the associated activation of the accumbens corridor.Behav Pharmacol. 2015 Sep;26(6):580-94. doi: 10.1097/FBP.0000000000000167. Behav Pharmacol. 2015. PMID: 26221832 Free PMC article. Review.
Cited by
-
Optogenetic inhibition of D1R containing nucleus accumbens neurons alters cocaine-mediated regulation of Tiam1.Front Mol Neurosci. 2013 May 24;6:13. doi: 10.3389/fnmol.2013.00013. eCollection 2013. Front Mol Neurosci. 2013. PMID: 23745104 Free PMC article.
-
Stress-Induced Locomotor Sensitization to Amphetamine in Adult, but not in Adolescent Rats, Is Associated with Increased Expression of ΔFosB in the Nucleus Accumbens.Front Behav Neurosci. 2016 Sep 12;10:173. doi: 10.3389/fnbeh.2016.00173. eCollection 2016. Front Behav Neurosci. 2016. PMID: 27672362 Free PMC article.
-
Chronic Cocaine Use and Parkinson's Disease: An Interpretative Model.Int J Environ Res Public Health. 2024 Aug 21;21(8):1105. doi: 10.3390/ijerph21081105. Int J Environ Res Public Health. 2024. PMID: 39200714 Free PMC article.
-
Class I HDAC inhibition blocks cocaine-induced plasticity by _targeted changes in histone methylation.Nat Neurosci. 2013 Apr;16(4):434-40. doi: 10.1038/nn.3354. Epub 2013 Mar 10. Nat Neurosci. 2013. PMID: 23475113 Free PMC article.
-
Reduction of Cocaine-Induced Locomotor Effects by Enriched Environment Is Associated with Cell-Specific Accumulation of ΔFosB in Striatal and Cortical Subregions.Int J Neuropsychopharmacol. 2017 Mar 1;20(3):237-246. doi: 10.1093/ijnp/pyw097. Int J Neuropsychopharmacol. 2017. PMID: 27815415 Free PMC article.
References
-
- Totterdell S., Smith A. D. J. Chem. Neuroanat. 1989;2:285–298. - PubMed
-
- Smith Y., Bevan M. D., Shink E., Bolam J. P. Neuroscience. 1998;86:353–387. - PubMed
-
- Heikkila R. E., Orlansky H., Cohen G. Biochem. Pharmacol. 1975;24:847–852. - PubMed
-
- Ritz M. C., Lamb R. J., Goldberg S. R., Kuhar M. J. Science. 1987;237:1219–1223. - PubMed
-
- Nestler E. J. Trends Pharmacol. Sci. 2004;25:210–218. - PubMed
Publication types
MeSH terms
Substances
Grants and funding
LinkOut - more resources
Full Text Sources
Other Literature Sources
Molecular Biology Databases
Miscellaneous

