An online database for brain disease research
- PMID: 16594998
- PMCID: PMC1489945
- DOI: 10.1186/1471-2164-7-70
An online database for brain disease research
Abstract
Background: The Stanley Medical Research Institute online genomics database (SMRIDB) is a comprehensive web-based system for understanding the genetic effects of human brain disease (i.e. bipolar, schizophrenia, and depression). This database contains fully annotated clinical metadata and gene expression patterns generated within 12 controlled studies across 6 different microarray platforms.
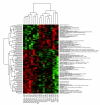
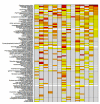
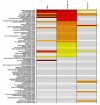
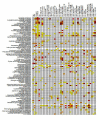
Description: A thorough collection of gene expression summaries are provided, inclusive of patient demographics, disease subclasses, regulated biological pathways, and functional classifications.
Conclusion: The combination of database content, structure, and query speed offers researchers an efficient tool for data mining of brain disease complete with information such as: cross-platform comparisons, biomarkers elucidation for _target discovery, and lifestyle/demographic associations to brain diseases.
Figures


Similar articles
-
MILANO--custom annotation of microarray results using automatic literature searches.BMC Bioinformatics. 2005 Jan 20;6:12. doi: 10.1186/1471-2105-6-12. BMC Bioinformatics. 2005. PMID: 15661078 Free PMC article.
-
The genopolis microarray database.BMC Bioinformatics. 2007 Mar 8;8 Suppl 1(Suppl 1):S21. doi: 10.1186/1471-2105-8-S1-S21. BMC Bioinformatics. 2007. PMID: 17430566 Free PMC article.
-
p53FamTaG: a database resource of human p53, p63 and p73 direct _target genes combining in silico prediction and microarray data.BMC Bioinformatics. 2007 Mar 8;8 Suppl 1(Suppl 1):S20. doi: 10.1186/1471-2105-8-S1-S20. BMC Bioinformatics. 2007. PMID: 17430565 Free PMC article.
-
Gene expression profiling in schizophrenia and related mental disorders.Neuroscientist. 2006 Aug;12(4):349-61. doi: 10.1177/1073858406287536. Neuroscientist. 2006. PMID: 16840711 Review.
-
Collecting, storing, and mining research data in a brain bank.Handb Clin Neurol. 2018;150:167-179. doi: 10.1016/B978-0-444-63639-3.00013-X. Handb Clin Neurol. 2018. PMID: 29496139 Review.
Cited by
-
Utilization of never-medicated bipolar disorder patients towards development and validation of a peripheral biomarker profile.PLoS One. 2013 Jun 24;8(6):e69082. doi: 10.1371/journal.pone.0069082. Print 2013. PLoS One. 2013. PMID: 23826396 Free PMC article.
-
Kinase network dysregulation in a human induced pluripotent stem cell model of DISC1 schizophrenia.Mol Omics. 2019 Jun 10;15(3):173-188. doi: 10.1039/c8mo00173a. Mol Omics. 2019. PMID: 31106784 Free PMC article.
-
Transcriptome profiling of human hippocampus dentate gyrus granule cells in mental illness.Transl Psychiatry. 2014 Mar 4;4(3):e366. doi: 10.1038/tp.2014.9. Transl Psychiatry. 2014. PMID: 24594777 Free PMC article.
-
Neurexin 1 variants as risk factors for suicide death.Mol Psychiatry. 2021 Dec;26(12):7436-7445. doi: 10.1038/s41380-021-01190-2. Epub 2021 Jun 25. Mol Psychiatry. 2021. PMID: 34168285 Free PMC article.
-
Connectivity Analyses of Bioenergetic Changes in Schizophrenia: Identification of Novel Treatments.Mol Neurobiol. 2019 Jun;56(6):4492-4517. doi: 10.1007/s12035-018-1390-4. Epub 2018 Oct 18. Mol Neurobiol. 2019. PMID: 30338483 Free PMC article.
References
-
- Iacobas DA, Urban M, Iacobas S, Spray DC. Control and variability of gene expression in mouse brain and in a neuroblastoma cell line. Rom J Physiol. 2003;39–40:2002–71. - PubMed
-
- Jurata LW, Bukhman YV, Charles V, Capriglione F, Bullard J, Lemire AL, Mohammed A, Pham Q, Laeng P, Brockman JA, Altar CA. Comparison of microarray-based mRMA profiling technologies for identification of psychiatric disease and drug signatures. J Neurosci Methods. 2004;138:173–88. doi: 10.1016/j.jneumeth.2004.04.002. - DOI - PubMed
MeSH terms
LinkOut - more resources
Full Text Sources
Medical

