Polyglutamine proteins at the pathogenic threshold display neuron-specific aggregation in a pan-neuronal Caenorhabditis elegans model
- PMID: 16855087
- PMCID: PMC6674286
- DOI: 10.1523/JNEUROSCI.0990-06.2006
Polyglutamine proteins at the pathogenic threshold display neuron-specific aggregation in a pan-neuronal Caenorhabditis elegans model
Abstract
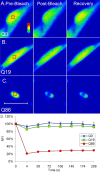
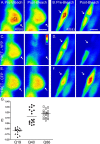
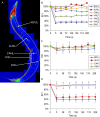
The basis of neuron-specific pathogenesis, resulting from the expression of misfolded proteins, is poorly understood and of central importance to an understanding of the cell-type specificity of neurodegenerative disease. In this study, we developed a new model for neuron-specific polyQ pathogenesis in Caenorhabditis elegans by pan-neuronal expression that exhibits polyQ length-dependent aggregation, neurotoxicity, and a pathogenic threshold at a length of 35-40 glutamines. Analysis of specific neurons in C. elegans revealed that only at the threshold length, but not at shorter or longer lengths, polyQ proteins can exist in a soluble state in certain lateral neurons or in an aggregated state in motor neurons of the same animal. These results provide direct experimental evidence that the expression of a single species of a toxic misfolded protein can exhibit a range of neuronal consequences.
Figures


Similar articles
-
Neuron-specific proteotoxicity of mutant ataxin-3 in C. elegans: rescue by the DAF-16 and HSF-1 pathways.Hum Mol Genet. 2011 Aug 1;20(15):2996-3009. doi: 10.1093/hmg/ddr203. Epub 2011 May 5. Hum Mol Genet. 2011. PMID: 21546381 Free PMC article.
-
An apparent core/shell architecture of polyQ aggregates in the aging Caenorhabditis elegans neuron.Protein Sci. 2021 Jul;30(7):1482-1486. doi: 10.1002/pro.4105. Epub 2021 May 22. Protein Sci. 2021. PMID: 33966305 Free PMC article.
-
Neuronal circuitry regulates the response of Caenorhabditis elegans to misfolded proteins.Proc Natl Acad Sci U S A. 2011 Aug 23;108(34):14204-9. doi: 10.1073/pnas.1106557108. Epub 2011 Aug 15. Proc Natl Acad Sci U S A. 2011. PMID: 21844355 Free PMC article.
-
The stress of misfolded proteins: C. elegans models for neurodegenerative disease and aging.Adv Exp Med Biol. 2007;594:167-89. doi: 10.1007/978-0-387-39975-1_15. Adv Exp Med Biol. 2007. PMID: 17205684 Review.
-
Genetic and pharmacological suppression of polyglutamine-dependent neuronal dysfunction in Caenorhabditis elegans.J Mol Neurosci. 2004;23(1-2):61-8. doi: 10.1385/JMN:23:1-2:061. J Mol Neurosci. 2004. PMID: 15126693 Review.
Cited by
-
Huntington disease models and human neuropathology: similarities and differences.Acta Neuropathol. 2008 Jan;115(1):55-69. doi: 10.1007/s00401-007-0306-6. Epub 2007 Nov 3. Acta Neuropathol. 2008. PMID: 17978822 Free PMC article. Review.
-
Comparison of the Huntington's Disease like 2 and Huntington's Disease Clinical Phenotypes.Mov Disord Clin Pract. 2019 Mar 12;6(4):302-311. doi: 10.1002/mdc3.12742. eCollection 2019 Apr. Mov Disord Clin Pract. 2019. PMID: 31061838 Free PMC article.
-
Proteasomes cleave at multiple sites within polyglutamine tracts: activation by PA28gamma(K188E).J Biol Chem. 2008 May 9;283(19):12919-25. doi: 10.1074/jbc.M709347200. Epub 2008 Mar 13. J Biol Chem. 2008. PMID: 18343811 Free PMC article.
-
Studying polyglutamine aggregation in Caenorhabditis elegans using an analytical ultracentrifuge equipped with fluorescence detection.Protein Sci. 2016 Mar;25(3):605-17. doi: 10.1002/pro.2854. Epub 2015 Dec 21. Protein Sci. 2016. PMID: 26647351 Free PMC article.
-
A novel interaction between aging and ER overload in a protein conformational dementia.Genetics. 2013 Mar;193(3):865-76. doi: 10.1534/genetics.112.149088. Epub 2013 Jan 18. Genetics. 2013. PMID: 23335331 Free PMC article.
References
-
- Albertson DG, Thomson JN (1976). The pharynx of Caenorhabditis elegans Philos Trans R Soc Lond B Biol Sci 275:299–325. - PubMed
-
- Altun-Gultekin Z, Andachi Y, Tsalik EL, Pilgrim D, Kohara Y, Hobert O (2001). A regulatory cascade of three homeobox genes, ceh-10, ttx-3 and ceh-23, controls cell fate specification of a defined interneuron class in Celegans Development 128:1951–1969. - PubMed
-
- Avery L (1993). Motor neuron M3 controls pharyngeal muscle relaxation timing in Caenorhabditis elegans J Exp Biol 175:283–297. - PubMed
-
- Avery L, Horvitz HR (1989). Pharyngeal pumping continues after laser killing of the pharyngeal nervous system of C elegans Neuron 3:473–485. - PubMed
-
- Bargmann CI, Kaplan JM (1998). Signal transduction in the Caenorhabditis elegans nervous system. Annu Rev Neurosci 21:279–308. - PubMed
Publication types
MeSH terms
Substances
Grants and funding
LinkOut - more resources
Full Text Sources
