Event-related functional near-infrared spectroscopy (fNIRS) based on craniocerebral correlations: reproducibility of activation?
- PMID: 17080439
- PMCID: PMC6871457
- DOI: 10.1002/hbm.20303
Event-related functional near-infrared spectroscopy (fNIRS) based on craniocerebral correlations: reproducibility of activation?
Abstract
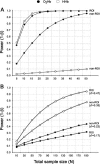
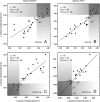
The purpose of the present study was to assess the retest reliability of cortical activation detected by event-related functional near-infrared spectroscopy (fNIRS) based on craniocerebral correlations. Isolated functional activation was evoked in the motor cortex by a periodically performed finger-tapping task. During 44-channel fNIRS recording, 12 subjects performed 30 trials of right and left index finger tapping in two sessions. The retest interval was set to 3 weeks. Simple correlations of the contrast t-values supplemented by scatterplots, channel-wise intraclass correlation coefficients (ICC), as well as reproducibility indices for the size and the location of the detected activation were calculated. The results at the group level showed sufficient single measure ICCs (up to 0.80) and excellent reproducibility of the size and the location (up to 89% were reproducible). Comparisons of the intersession group amplitudes demonstrate that the fNIRS signals were stable across time in a retest study design: the number of significant differences was less than randomly occurring false-positive activated channels if an alpha level of 5% is chosen. Effect size analyses indicated that the intersession amplitude differences are small (mean < 0.25). For deoxyhemoglobin and oxyhemoglobin distinct statistical power profiles were revealed regarding the activation vs. baseline contrast as well as the intersession amplitude differences, indicating a higher sensitivity of deoxyhemoglobin for local hemodynamic changes. The results suggest that sensorimotor activation assessed by event-related fNIRS based on craniocerebral correlations is sufficiently reproducible at the group level.
2006 Wiley-Liss, Inc
Figures


Similar articles
-
Event-related functional near-infrared spectroscopy (fNIRS): are the measurements reliable?Neuroimage. 2006 May 15;31(1):116-24. doi: 10.1016/j.neuroimage.2005.12.008. Epub 2006 Jan 30. Neuroimage. 2006. PMID: 16446104
-
A semi-immersive virtual reality incremental swing balance task activates prefrontal cortex: a functional near-infrared spectroscopy study.Neuroimage. 2014 Jan 15;85 Pt 1:451-60. doi: 10.1016/j.neuroimage.2013.05.031. Epub 2013 May 17. Neuroimage. 2014. PMID: 23684867
-
Separation of fNIRS signals into functional and systemic components based on differences in hemodynamic modalities.PLoS One. 2012;7(11):e50271. doi: 10.1371/journal.pone.0050271. Epub 2012 Nov 19. PLoS One. 2012. PMID: 23185590 Free PMC article.
-
A consensus guide to using functional near-infrared spectroscopy in posture and gait research.Gait Posture. 2020 Oct;82:254-265. doi: 10.1016/j.gaitpost.2020.09.012. Epub 2020 Sep 18. Gait Posture. 2020. PMID: 32987345 Review.
-
Assessment of the cerebral cortex during motor task behaviours in adults: a systematic review of functional near infrared spectroscopy (fNIRS) studies.Neuroimage. 2011 Feb 14;54(4):2922-36. doi: 10.1016/j.neuroimage.2010.10.058. Epub 2010 Oct 26. Neuroimage. 2011. PMID: 21029781 Review.
Cited by
-
Optical imaging and spectroscopy for the study of the human brain: status report.Neurophotonics. 2022 Aug;9(Suppl 2):S24001. doi: 10.1117/1.NPh.9.S2.S24001. Epub 2022 Aug 30. Neurophotonics. 2022. PMID: 36052058 Free PMC article.
-
Changes in cortical blood oxygenation during arithmetical tasks measured by near-infrared spectroscopy.J Neural Transm (Vienna). 2009 Mar;116(3):267-73. doi: 10.1007/s00702-008-0168-7. Epub 2008 Dec 19. J Neural Transm (Vienna). 2009. PMID: 19096903
-
Impact of ASL Exposure on Spoken Phonemic Discrimination in Adult CI Users: A Functional Near-Infrared Spectroscopy Study.Neurobiol Lang (Camb). 2024 Jun 14;5(2):553-588. doi: 10.1162/nol_a_00143. eCollection 2024. Neurobiol Lang (Camb). 2024. PMID: 38939730 Free PMC article.
-
Test-retest reliability of functional near-infrared spectroscopy during a finger-tapping and postural task in healthy older adults.Neurophotonics. 2023 Apr;10(2):025010. doi: 10.1117/1.NPh.10.2.025010. Epub 2023 May 26. Neurophotonics. 2023. PMID: 37250101 Free PMC article.
-
Flexible circuit-based spatially aware modular optical brain imaging system for high-density measurements in natural settings.Neurophotonics. 2024 Jul;11(3):035002. doi: 10.1117/1.NPh.11.3.035002. Epub 2024 Jul 5. Neurophotonics. 2024. PMID: 38975286 Free PMC article.
References
-
- Boas DA, Dale AM, Franceschini MA ( 2004a): Diffuse optical imaging of brain activation: approaches to optimizing image sensitivity, resolution, and accuracy. Neuroimage 23( Suppl 1): S275–288. - PubMed
-
- Boas DA, Chen K, Grebert D, Franceschini MA ( 2004b): Improving the diffuse optical imaging spatial resolution of the cerebral hemodynamic response to brain activation in humans. Opt Lett 29: 1506–1508. - PubMed
-
- Bullmore E, Brammer M, Williams SC, Rabe Hesketh S, Janot N, David A, Mellers J, Howard R, Sham P ( 1996): Statistical methods of estimation and inference for functional MR image analysis. Magn Reson Med 35: 261–277. - PubMed
-
- Charter RA ( 2003): A breakdown of reliability coefficients by test type and reliability method, and the clinical implications of low reliability. J Gen Psychol 130: 290–304. - PubMed
-
- Cochrane D, Orcutt G ( 1949): Application of least squares regression to relationships containing autocorrelated error terms. J Am Stat Assoc 44: 32–61.
Publication types
MeSH terms
Substances
LinkOut - more resources
Full Text Sources

