. 2007 May 1;109(9):3906-14.
doi: 10.1182/blood-2006-07-036335. Epub 2007 Jan 11.

Myeloproliferative disease induced by TEL-PDGFRB displays dynamic range sensitivity to Stat5 gene dosage

Affiliations

Myeloproliferative disease induced by TEL-PDGFRB displays dynamic range sensitivity to Stat5 gene dosage

Jennifer A Cain et al. Blood. .

Abstract

Expression of the constitutively activated TEL/PDGFbetaR fusion protein is associated with the t(5;12)(q33;p13) chromosomal translocation found in a subset of patients with chronic myelomonocytic leukemia. TEL/PDGFbetaR activates multiple signal transduction pathways in cell-culture systems, and expression of the TEL-PDGFRB fusion gene induces myeloproliferative disease (MPD) in mice. We used gene-_targeted mice to characterize the contribution of signal transducer and activator of transcription (Stat) and Src family genes to TEL-PDGFRB-mediated transformation in methylcellulose colony and murine bone marrow transduction/transplantation assays. Fetal liver hematopoietic stem and progenitor cells harboring _targeted deletion of both Stat5a and Stat5b (Stat5ab(null/null)) genes were refractory to transformation by TEL-PDGFRB in methylcellulose colony assays. Notably, these cell populations were maintained in Stat5ab(null/null) fetal livers and succumbed to transformation by c-Myc. Surprisingly, _targeted disruption of either Stat5a or Stat5b alone also impaired TEL-PDGFRB-mediated transformation. Survival of TPiGFP-->Stat5a(-/-) and TPiGFP-->Stat5a(+/-) mice was significantly prolonged, demonstrating significant sensitivity of TEL-PDGFRB-induced MPD to the dosage of Stat5a. TEL-PDGFRB-mediated MPD was incompletely penetrant in TPiGFP-->Stat5b(-/-) mice. In contrast, Src family kinases Lyn, Hck, and Fgr and the Stat family member Stat1 were dispensable for TEL-PDGFRB disease. Together, these data demonstrate that Stat5a and Stat5b are dose-limiting mediators of TEL-PDGFRB-induced myeloproliferation.


Figures

Figure 1
Figure 1
Stat5 is required in primary murine hematopoietic cells for TEL-PDGFRB–mediated growth. (A) Cytokine-independent colony formation of 14.5-dpc fetal liver cells expressing either TEL-PDGFRB or c-Myc. Data shown are the mean percentage of colonies formed by Stat5abnull/null and Stat5ab+/null cells relative to Stat5ab+/+ cells for a given experimental condition. Error bars represent standard deviation. TPNeo induced formation of 195 ± 18 Stat5ab+/+, 194 ± 19 Stat5ab+/null, and 3 ± 1 Stat5abnull/null G418-resistant colonies per 105 transduced fetal liver cells. Positive control c-Myc induced formation of 159 ± 8 colonies per 105 Stat5abnull/null fetal liver cells plated and 184 ± 31 colonies in Stat5ab+/+ cells. Cells transduced with negative control MSCV-Neo did not form colonies in the absence of cytokines (data not shown). Transduction efficiency of Stat5ab+/+ and Stat5abnull/null fetal liver cells with MSCV-Myc was 14% and 12% for 2 independent experiments. For TPNeo and MSCV-Neo, transduction efficiency of Stat5ab+/+ cells averaged 25% ± 15% and Stat5abnull/null cells averaged 45% ± 16% for 7 independent transductions of each genotype. (B) TEL-PDGFRB induced cytokine independent colony formation in Stat5a+/+ (469 ± 26 colonies per 105 transduced cells), Stat5a+/− (266 ± 40), and Stat5a−/− (163 ± 16) whole bone marrow cells. Data shown are the mean percentage of colonies formed by Stat5a−/− and Stat5a+/− cells relative to Stat5a+/+ cells for a given experimental condition. Error bars represent standard deviation. Transduction efficiency of Stat5a−/− cells averaged 98% ± 17% and 93% ± 18% for Stat5a+/+ bone marrow cells in 3 independent transductions. (C) TEL-PDGFRB induced cytokine-independent colony formation in Stat5b+/+ (602 ± 39 colonies per 105 transduced cells), Stat5b+/− (135 ± 25), and Stat5b−/− (27 ± 11) whole bone marrow cells. Data shown are the mean percentage of colonies formed by Stat5b−/− and Stat5b+/− cells relative to Stat5b+/+ cells for a given experimental condition. Error bars represent standard deviation. Transduction efficiency of Stat5b−/− cells was 99% and 81% for Stat5b+/+ bone marrow cells. (TPNeo indicates TEL-PDGFRB-PGK Neo; MSCV-Myc, MSCV-c-Myc ires GFP; and ND, not done.)
Figure 2
Figure 2
Hematopoietic stem and progenitor-cell populations are preserved in fetal livers of Stat5abnull/null mice. (A) Flow cytometric analysis of Stat5abnull/null, Stat5ab+/null, and Stat5ab+/+ 14.5-dpc fetal livers for early hematopoietic cells. Top panel shows Kit and Sca-1 expression of lineage-negative fetal liver cells. Bottom panel shows CMP (FcγRloCD34+), MEP (FcγRloCD34), and GMP (FcγRhiCD34+) populations, with percentage of Kit+LinSca falling into each progenitor population as indicated. (B) Proportion of cells that is identified as either KLS (black), progenitors (CMPs, MEPs, or GMPs, diagonal stripes), or lineage-committed (gray) hematopoietic cells within Stat5ab+/+, Stat5ab+/null, and Stat5abnull/null 14.5-dpc fetal livers as determined by flow cytometric detection of cell-surface markers. (C) Cytokine-dependent colony formation of vector-transduced 14.5-dpc fetal liver cells when cells were plated in the presence of SCF, IL3, IL6, and EPO. Data shown are the mean percentage of colonies formed by Stat5abnull/null and Stat5ab+/null cells relative to Stat5ab+/+ cells. Error bars represent standard deviation. Vector control Stat5ab+/+ cells generated 688 ± 18 G418-resistant colonies per 105 transduced fetal liver cells, while Stat5ab+/null and Stat5abnull/null cells formed 535 ± 12 and 355 ± 10 colonies. TPNeo-transduced Stat5ab+/+, Stat5ab+/null, and Stat5abnull/null cells formed 337 ± 33, 559 ± 43, and 321 ± 30 G418 colonies, respectively. Transduction efficiency of Stat5ab+/+ cells averaged 25% ± 15% and Stat5abnull/null cells averaged 45% ± 16% for 7 independent transductions of each genotype. (KLS indicates Kit+Sca+Lin; CMP, common myeloid progenitor; MEP, megakaryocyte-erythrocyte progenitor; and GMP, granulocyte-monocyte progenitor.)
Figure 3
Figure 3
Stat5a gene dosage mediates the latency of TEL-PDGFRB–induced myeloproliferation. (A) Kaplan-Meier plot shows survival of recipient mice when TEL-PDGFRB is expressed in bone marrow cells harboring homozygous or heterozygous inactivation of Stat5a. TPiGFPStat5a+/+ mice (circles) developed severe MPD (spleen weight median, 790 ± 90 mg; range, 620-910 mg; n = 6). TPiGFPStat5a+/− mice (▵) developed moderate or severe MPD (spleen weight median, 770 ± 300 mg; range, 350-1120 mg; n = 7). TPiGFPStat5a−/− mice (squares) developed moderate MPD with splenomegaly (spleen weight, 710 ± 550 mg; range, 350-2070 mg; n = 8) and leukocytosis. Black shapes indicate death due to severe (fatal) MPD marked by leukocytosis and splenomegaly (WBC, > 50 × 109/L [50 000/μL] and spleen weight, > 450 mg) at time of death due to disease. Shaded shapes represent moderate MPD (WBC, > 15 × 109/L [15 000/μL] and/or spleen weight, > 450 mg) at time of death due to disease. Open shapes indicate animal found dead. (B) Median peripheral blood cell count at time of death due to disease. Error bars represent standard deviation. TEL-PDGFRB induced severe leukocytosis in TPiGFPStat5a+/+ mice (359 ± 225 × 109/L [359 000 ± 225 000/μL]; range, 60-737 × 109/L [60 000-737 000/μL]; n = 6) and moderate leukocytosis in TPiGFPStat5a+/− mice (28 ± 15 × 109/L [28 000 ± 15 000/μL]; range, 12-131 × 109/L [12 000-131 000/μL]; n = 7) as well as TPiGFPStat5a−/− mice (29 ± 27 × 109/L [29 000 ± 27 000/μL];range, 10-94 × 109/L [10 000-94 000/μL]; n = 8). (C) Three mice from each cohort were analyzed 28 days after transplantation. Median of peripheral blood counts is shown. Error bars represent standard deviation. Peripheral blood counts of GFPStat5a−/− control mice are also shown. (TPiGFP indicates TEL-PDGFRB ires eGFP; MPD, myeloproliferative disease; and WBC, peripheral white blood cell count.)
Figure 4
Figure 4
Severity and penetrance of TEL-PDGFRB–induced myeloproliferation are reduced in the absence of Stat5b. (A) Kaplan-Meier plot shows survival of recipient mice when TEL-PDGFRB is expressed in bone marrow cells harboring _targeted deletion of Stat5b (TPiGFPStat5b−/−, squares) or wild-type control bone marrow cells (TPiGFPStat5b+/+, ○). TPiGFPStat5b+/+ mice developed severe MPD (spleen weight median, 890 ± 274 mg; range, 670-1460 mg [n = 6]; WBC median, 139 ± 87 × 109/L [139 000 ± 87 000/μL]; range, 13-237 × 109/L [13 000-237 000/μL] [n = 6]; median survival ± standard error, 33 ± 2.9 days). Severe MPD was detected in 5 of 7 TPiGFPStat5b−/− mice at time of death due to disease (spleen weight median, 1220 ± 401 mg; range, 420-1440 mg [n = 7]; WBC median, 103 ±151 × 109/L [103 000 ± 151 000/μL]; range, 6-446 × 109/L [6000-446 000/μL] [n = 7]; median survival ± standard error, 57 ± 60.2 days). Experiment was performed twice, once in the original outbred strain with wild-type littermate control and again with the _targeted Stat5b allele backcrossed to balb/c resulting in similar disease latency and severity. Black shapes indicate death due to severe MPD marked by leukocytosis and splenomegaly (WBC, > 50 × 109/L [50 000/μL] and spleen weight, > 450 mg) at time of death due to disease. Shaded shapes represent moderate MPD (WBC, > 15 × 109/L [15 000/μL] and/or spleen weight, > 450 mg) at time of death due to disease. Open shapes indicate animal found dead. GFP was detected in bone marrow, spleen, and peripheral blood of TPiGFPStat5b−/− (37% ± 4% [n = 7]; 50% ± 15% [n = 7]; and 58% ± 32% [n = 7], respectively) and TPiGFPStat5b+/+ (44% [n = 1]; 50% ± 15% [n = 3]; and 58% ± 32% [n = 3], respectively) recipient mice (data not shown). (B) Flow cytometric detection of mature myeloid (Gr-1+Mac-1+) cells in the spleens of both TPiGFPStat5b+/+ and TPiGFPStat5b−/− mice 33 days after transplantation. (C) Microscopic images of representative mice at time of death (GFPStat5b+/+, 151 days after transplantation; TPiGFPStat5b+/+, 29 days after transplantation; and TPiGFPStat5b−/−, 29 days after transplantation). Panels show Wright-Giemsa–stained smears of peripheral blood (Ci-iii; 100×), and H&E–stained histologic sections of spleen (Civ-vi; 20×) and liver (Cvii-ix; 40×). These illustrate a normal morphology of peripheral blood, spleen, and liver in the GFPStat5b+/+ group, whereas both TPiGFPStat5b+/+ and TPiGFPStat5b−/− show marked leukocytosis of maturing neutrophils in the peripheral blood, pronounced red pulp expansion by myeloid hyperplasia composed of predominantly maturing forms in the spleen, and sinusoidal and perivascular infiltrates of maturing granulocytic cells in the liver. Arrows indicate clusters of maturing myeloid cells in the liver. (TPiGFP indicates TEL-PDGFRB ires eGFP; MPD, myeloproliferative disease; WBC, peripheral white blood cell count; PB, peripheral blood; Sp, spleen; and Li, liver.)
Figure 5
Figure 5
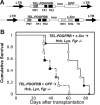
TEL-PDGFRB–mediated myeloproliferative disease does not require Src family members Lyn, Hck, and Fgr.(A) Retroviral constructs encode TEL-PDGFRB followed by an internal ribosomal entry site to allow expression of a second cDNA, either GFP or c-Src. (B) Kaplan-Meier plot of recipient mouse survival when TEL-PDGFRB is coexpressed with either GFP (□) or c-Src (○) in Hck-, Lyn-, and Fgr-deficient cells. The 4 TPiGFPLyn−/−Hck−/−Fgr−/− mice had varying degrees of disease severity (spleen weight, 445 ± 273 mg; range, 270-590 mg; median WBC, 38 ± 66 × 109/L [38 000 ± 66 000/μL]; range, 14-156 × 109/L [14 000-156 000/μL]). MPD was detected in 3 of 3 TPiSrcLyn−/−Hck−/−Fgr−/− mice analyzed for disease severity at time of death (spleen weight median, 590 ± 190 mg; range, 480-850 mg; median WBC, 86 ±839 × 109/L [86 000 ± 839 000/μL]; range, 14-1502 × 109/L [14 000-1 502 000 000/μL]). Black shapes indicate death due to severe MPD marked by leukocytosis and splenomegaly (WBC, > 50 × 109/L [50 000/μL] and spleen weight, > 450 mg) at time of death due to disease. Shaded shapes represent moderate MPD (WBC, > 15 × 109/L [15 000/μL] and/or spleen weight, > 450 mg) at time of death due to disease. Open shapes indicate animal found dead. (ires indicates internal ribosomal entry site; GFP, green fluorescent protein; LTR, long terminal repeat; PNT, pointed domain; TK, tyrosine kinase; MPD, myeloproliferative disease; and WBC, peripheral white blood cell count.)

Similar articles

Cited by

References

    1. Golub TR, Barker GF, Lovett M, Gilliland DG. Fusion of PDGF receptor beta to a novel ets-like gene, tel, in chronic myelomonocytic leukemia with t(5;12) chromosomal translocation. Cell. 1994;77:307–316. - PubMed
    1. Carroll M, Tomasson MH, Barker GF, Golub TR, Gilliland DG. The TEL/platelet-derived growth factor beta receptor (PDGF beta R) fusion in chronic myelomonocytic leukemia is a transforming protein that self-associates and activates PDGF beta R kinase-dependent signaling pathways. Proc Natl Acad Sci U S A. 1996;93:14845–14850. - PMC - PubMed
    1. Jousset C, Carron C, Boureux A, et al. A domain of TEL conserved in a subset of ETS proteins defines a specific oligomerization interface essential to the mitogenic properties of the TEL-PDGFR beta oncoprotein. EMBO J. 1997;16:69–82. - PMC - PubMed
    1. Tran HH, Kim CA, Faham S, Siddall MC, Bowie JU. Native interface of the SAM domain polymer of TEL. BMC Struct Biol. 2002;2:5. - PMC - PubMed
    1. Bourgeade MF, Defachelles AS, Cayre YE. Myc is essential for transformation by TEL/platelet-derived growth factor receptor beta (PDGFRbeta). Blood. 1998;91:3333–3339. - PubMed

Publication types

MeSH terms

Substances

  NODES
INTERN 4
twitter 2