Nonredundant roles for Stat5a/b in directly regulating Foxp3
- PMID: 17227828
- PMCID: PMC1885496
- DOI: 10.1182/blood-2006-11-055756
Nonredundant roles for Stat5a/b in directly regulating Foxp3
Abstract
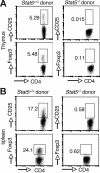
Stats (signal transducers and activators of transcription) regulate multiple aspects of T-cell fate. T regulatory (Treg) cells are a critical subset that limits immune responses, but the relative importance of Stat5a/b versus Stat3 for Treg cell development has been contentious. We observed that peripheral CD25(+)CD4(+) T cells were reduced in Stat5(DeltaN) mice; however, the levels of Foxp3, a transcription factor that is critical for Treg cells, were normal in splenic CD4(+) T cells even though they were reduced in the thymus. In contrast, complete deletion of Stat5a/b (Stat5(-/-)) resulted in dramatic reduction in CD25- or Foxp3-expressing CD4(+) T cells. An intrinsic requirement was demonstrated by reduction of Stat5a/b in CD4-expressing cells and by stem cell transplantation using Stat5(-/-) fetal liver cells. Stat5a/b were also required for optimal induction of Foxp3 in vitro and bound directly to the Foxp3 gene. Reduction of Stat3 in T cells did not reduce the numbers of Treg cells in the thymus or spleen; however, Stat3 was required for IL-6-dependent down-regulation of Foxp3. Therefore, we conclude that Stat5a/b have an essential, nonredundant role in regulating Treg cells, and that Stat3 and Stat5a/b appear to have opposing roles in the regulation of Foxp3.
Figures


Similar articles
-
Differentiating the roles of STAT5B and STAT5A in human CD4+ T cells.Clin Immunol. 2013 Aug;148(2):227-36. doi: 10.1016/j.clim.2013.04.014. Epub 2013 May 5. Clin Immunol. 2013. PMID: 23773921 Free PMC article.
-
STAT5-signaling cytokines regulate the expression of FOXP3 in CD4+CD25+ regulatory T cells and CD4+CD25- effector T cells.Int Immunol. 2008 Mar;20(3):421-31. doi: 10.1093/intimm/dxn002. Epub 2008 Feb 12. Int Immunol. 2008. PMID: 18270368
-
[Effects of Yiqi Bushen Experimental Recipe on mRNA Expressions of foxp3, STAT5, and NF-KB in Decidua Tissue of Natural Abortion Model Mice].Zhongguo Zhong Xi Yi Jie He Za Zhi. 2016 Aug;36(8):946-952. Zhongguo Zhong Xi Yi Jie He Za Zhi. 2016. PMID: 30640990 Chinese.
-
Role of STAT3 in CD4+CD25+FOXP3+ regulatory lymphocyte generation: implications in graft-versus-host disease and antitumor immunity.J Immunol. 2007 Dec 1;179(11):7593-604. doi: 10.4049/jimmunol.179.11.7593. J Immunol. 2007. PMID: 18025205
-
New insights into the roles of Stat5a/b and Stat3 in T cell development and differentiation.Semin Cell Dev Biol. 2008 Aug;19(4):394-400. doi: 10.1016/j.semcdb.2008.07.011. Epub 2008 Jul 30. Semin Cell Dev Biol. 2008. PMID: 18708155 Free PMC article. Review.
Cited by
-
MKL-1 is a coactivator for STAT5b, the regulator of Treg cell development and function.Cell Commun Signal. 2020 Jul 9;18(1):107. doi: 10.1186/s12964-020-00574-1. Cell Commun Signal. 2020. PMID: 32646440 Free PMC article.
-
Regulatory T cells, mTOR kinase, and metabolic activity.Cell Mol Life Sci. 2012 Dec;69(23):3975-87. doi: 10.1007/s00018-012-1058-6. Epub 2012 Jul 4. Cell Mol Life Sci. 2012. PMID: 22760498 Free PMC article. Review.
-
Cytokine regulation of immune tolerance.Burns Trauma. 2014 Jan 26;2(1):11-7. doi: 10.4103/2321-3868.124771. eCollection 2014. Burns Trauma. 2014. PMID: 27574641 Free PMC article.
-
Developmental Adaptive Immune Defects Associated with STAT5B Deficiency in Three Young Siblings.J Clin Immunol. 2021 Jan;41(1):136-146. doi: 10.1007/s10875-020-00884-6. Epub 2020 Oct 22. J Clin Immunol. 2021. PMID: 33090292 Free PMC article.
-
An essential role for the IL-2 receptor in Treg cell function.Nat Immunol. 2016 Nov;17(11):1322-1333. doi: 10.1038/ni.3540. Epub 2016 Sep 5. Nat Immunol. 2016. PMID: 27595233 Free PMC article.
References
-
- Shuai K, Liu B. Regulation of JAK-STAT signalling in the immune system. Nat Rev Immunol. 2003;3:900–911. - PubMed
-
- O'Shea JJ, Gadina M, Schreiber RD. Cytokine signaling in 2002: new surprises in the Jak/Stat pathway. Cell. 2002;109:S121–S131. - PubMed
-
- Feldman GM, Rosenthal LA, Liu X, et al. STAT5A-deficient mice demonstrate a defect in granulocyte-macrophage colony-stimulating factor-induced proliferation and gene expression. Blood. 1997;90:1768–1776. - PubMed
Publication types
MeSH terms
Substances
Grants and funding
LinkOut - more resources
Full Text Sources
Other Literature Sources
Molecular Biology Databases
Research Materials
Miscellaneous

