Pericentromeric heterochromatin domains are maintained without accumulation of HP1
- PMID: 17314413
- PMCID: PMC1838966
- DOI: 10.1091/mbc.e06-01-0025
Pericentromeric heterochromatin domains are maintained without accumulation of HP1
Abstract
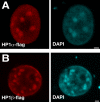
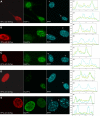
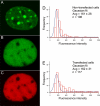
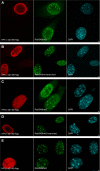
The heterochromatin protein 1 (HP1) family is thought to be an important structural component of heterochromatin. HP1 proteins bind via their chromodomain to nucleosomes methylated at lysine 9 of histone H3 (H3K9me). To investigate the role of HP1 in maintaining heterochromatin structure, we used a dominant negative approach by expressing truncated HP1alpha or HP1beta proteins lacking a functional chromodomain. Expression of these truncated HP1 proteins individually or in combination resulted in a strong reduction of the accumulation of HP1alpha, HP1beta, and HP1gamma in pericentromeric heterochromatin domains in mouse 3T3 fibroblasts. The expression levels of HP1 did not change. The apparent displacement of HP1alpha, HP1beta, and HP1gamma from pericentromeric heterochromatin did not result in visible changes in the structure of pericentromeric heterochromatin domains, as visualized by DAPI staining and immunofluorescent labeling of H3K9me. Our results show that the accumulation of HP1alpha, HP1beta, and HP1gamma at pericentromeric heterochromatin domains is not required to maintain DAPI-stained pericentromeric heterochromatin domains and the methylated state of histone H3 at lysine 9 in such heterochromatin domains.
Figures


Similar articles
-
Truncated HP1 lacking a functional chromodomain induces heterochromatinization upon in vivo _targeting.Histochem Cell Biol. 2006 Jan;125(1-2):53-61. doi: 10.1007/s00418-005-0088-7. Epub 2005 Nov 10. Histochem Cell Biol. 2006. PMID: 16283356
-
HP1 recruits activity-dependent neuroprotective protein to H3K9me3 marked pericentromeric heterochromatin for silencing of major satellite repeats.PLoS One. 2011 Jan 18;6(1):e15894. doi: 10.1371/journal.pone.0015894. PLoS One. 2011. PMID: 21267468 Free PMC article.
-
Structural Basis of Heterochromatin Formation by Human HP1.Mol Cell. 2018 Feb 1;69(3):385-397.e8. doi: 10.1016/j.molcel.2017.12.011. Epub 2018 Jan 11. Mol Cell. 2018. PMID: 29336876
-
HP1: heterochromatin binding proteins working the genome.Epigenetics. 2010 May 16;5(4):287-92. doi: 10.4161/epi.5.4.11683. Epub 2010 May 3. Epigenetics. 2010. PMID: 20421743 Free PMC article. Review.
-
How HP1 Post-Translational Modifications Regulate Heterochromatin Formation and Maintenance.Cells. 2020 Jun 12;9(6):1460. doi: 10.3390/cells9061460. Cells. 2020. PMID: 32545538 Free PMC article. Review.
Cited by
-
Dynamic Heterochromatin States in Anisotropic Nuclei of Cells on Aligned Nanofibers.ACS Nano. 2022 Jul 26;16(7):10754-10767. doi: 10.1021/acsnano.2c02660. Epub 2022 Jul 8. ACS Nano. 2022. PMID: 35803582 Free PMC article.
-
Trichostatin A decreases the levels of MeCP2 expression and phosphorylation and increases its chromatin binding affinity.Epigenetics. 2017;12(11):934-944. doi: 10.1080/15592294.2017.1380760. Epub 2017 Dec 5. Epigenetics. 2017. PMID: 29099289 Free PMC article.
-
HP1α is not necessary for the structural maintenance of centromeric heterochromatin.Epigenetics. 2011 Mar;6(3):380-7. doi: 10.4161/epi.6.3.13866. Epub 2011 Mar 1. Epigenetics. 2011. PMID: 20962594 Free PMC article.
-
Heterochromatin protein 1 is recruited to various types of DNA damage.J Cell Biol. 2009 May 18;185(4):577-86. doi: 10.1083/jcb.200810035. J Cell Biol. 2009. PMID: 19451271 Free PMC article.
-
Sir3 mediates long-range chromosome interactions in budding yeast.Genome Res. 2021 Mar;31(3):411-425. doi: 10.1101/gr.267872.120. Epub 2021 Feb 12. Genome Res. 2021. PMID: 33579753 Free PMC article.
References
-
- Bannister A. J., Zegerman P., Partridge J. F., Miska E. A., Thomas J. O., Allshire R. C., Kouzarides T. Selective recognition of methylated lysine 9 on histone H3 by the HP1 chromo domain. Nature. 2001;410:120–124. - PubMed
-
- Brink M. C., van der Velden Y., de Leeuw W., Mateos-Langerak J., Belmont A. S., van Driel R., Verschure P. J. Truncated HP1 lacking a functional chromodomain induces heterochromatinization upon in vivo _targeting. Histochem. Cell Biol. 2006;125:53–61. - PubMed
-
- Cheutin T., McNairn A. J., Jenuwein T., Gilbert D. M., Singh P. B., Misteli T. Maintenance of stable heterochromatin domains by dynamic HP1 binding. Science. 2003;299:721–725. - PubMed
Publication types
MeSH terms
Substances
LinkOut - more resources
Full Text Sources
Other Literature Sources
Molecular Biology Databases
Research Materials

