. 2007 May;27(9):3405-16.
doi: 10.1128/MCB.00066-07. Epub 2007 Feb 26.

Loss of Gcn5 acetyltransferase activity leads to neural tube closure defects and exencephaly in mouse embryos

Affiliations

Loss of Gcn5 acetyltransferase activity leads to neural tube closure defects and exencephaly in mouse embryos

Ping Bu et al. Mol Cell Biol. 2007 May.

Abstract

Gcn5 was the first transcription-related histone acetyltransferase (HAT) to be identified. However, the functions of this enzyme in mammalian cells remain poorly defined. Deletion of Gcn5 in mice leads to early embryonic lethality with increased apoptosis in mesodermal lineages. Here we show that deletion of p53 allows Gcn5(-/-) embryos to survive longer, but Gcn5(-/-) p53(-/-) embryos still die in midgestation. Interestingly, embryos homozygous for point mutations in the Gcn5 catalytic domain survive significantly longer than Gcn5(-/-) or Gcn5(-/-) p53(-/-) mice. In contrast to Gcn5(-/-) embryos, Gcn5(hat/hat) embryos do not exhibit increased apoptosis but do exhibit severe cranial neural tube closure defects and exencephaly. Together, our results indicate that Gcn5 has important, HAT-independent functions in early development and that Gcn5 acetyltransferase activity is required for cranial neural tube closure in the mouse.


Figures
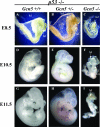
FIG. 1.
FIG. 1.
Morphology of Gcn5−/− p53−/− embryos. Lateral views of E8.5 to E11.5 embryos indicate that Gcn5+/+ p53−/− and Gcn5+/− p53−/− embryos exhibit a wild-type phenotype, whereas Gcn5−/− p53−/− double null embryos show delayed development and exhibit abnormal morphologies at E10.5 and E11.5. hd, head; hrt, heart.
FIG. 2.
FIG. 2.
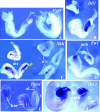
Normal expression of developmental markers in Gcn5 −/− p53 −/− embryos. Whole-mount in situ analyses of E8.5 to E9.0 embryos are shown for each of the indicated genes. The smaller embryo in each panel is Gcn5−/− p53−/−, and the larger embryo is a Gcn5+/+ p53−/− or Gcn5+/− p53−/− littermate. In each case, the timing and spatial distribution of the indicated marker gene were unchanged in the double null embryos. al, allantois; fob, forebrain; hm, head mesenchyme; mib, midbrain; mmb, mesencephalon-metencephalon border; ntc, notochord; pe, posterior end.
FIG. 3.
FIG. 3.
Creation of Gcn5hat/+ mice. (A) Strategy to introduce an allele of Gcn5 bearing two point mutations (E568A and D609A) in sequences encoding the catalytic center of the enzyme into the native Gcn5 chromosomal locus. The locations of the mutations (*) and EcoRI (RI) and EcoRV (RV) restriction sites used for genotyping by Southern blot analyses are shown together with the locations of 5′ and 3′ probes. Exons are depicted as boxes and introns as intervening lines. Note that only a portion (exons 8 to 19) of the Gcn5 gene is shown. The white boxes indicate the portion of the _targeting vector that was subcloned for mutagenesis and then reinserted into the _targeting vector. The positions of a PGKneobpA neomycin resistance expression cassette (NEO) and MC1-TK (thymidine kinase) cassette are also shown. (B) Southern blots to identify Gcn5hat/+ ES cells or mice. 5′ and 3′ probes (as indicated in panel A) were used to detect EcoRI/EcoRV digestion products corresponding to the wild-type (6.9-kb) or _targeted (4.3- or 4.5-kb) Gcn5 alleles. (C) PCR genotyping to confirm the presence of the point mutations in Gcn5hat/hat embryos. PCR products flanking each mutation site were generated as described in Materials and Methods (top blot). The E568A mutation is linked to a PvuI restriction site, and the D609A mutation is linked to a PstI restriction site. Cleavage of the PCR products by these enzymes (bottom blots) confirms the presence of the mutations. The two PstI cleavage products are close in size (202 and 223 bp) and migrate as a single band.
FIG. 4.
FIG. 4.
Acetylation of histones H3 and H4 in MEFs. (A) HAT assays to measure acetyltransferase activity of equal amounts of wild-type or mutant versions of Gcn5 expressed in bacteria. The activity of wild-type Gcn5 was set at 100%. (B) Immunoblots to compare expression of wild-type and mutant Gcn5 proteins in MEFs isolated from E13.5 embryos. Gcn5 levels were normalized to levels of β-actin, and Gcn5 expression in wild-type cells was set at 1.0. (C) Representative immunoblots comparing levels of H3 and H4 acetylation at the indicated sites in wild-type, Gcn5hat/+, and Gcn5hat/hat MEFs are shown. Numbers underneath the blots represent averages of signals from multiple blots. Acetylated H3 (Ac H3) or H4 levels were normalized to total H3 or H4, and levels in wild-type cells were set at 1.0.
FIG. 5.
FIG. 5.
Gcn5hat/hat embryos exhibit defects in neural tube closure and exencephaly. Lateral views of embryos at the indicated time points. (A) Wild-type embryo; (B and B') Gcn5hat/hat embryos. In all other panels, the embryo on the left is a wild-type or Gcn5hat/+ embryo, and the embryo on the right (and in the middle in panel F) is a Gcn5hat/hat embryo.
FIG. 6.
FIG. 6.
Apoptosis in Gcn5hat/hat embryos. (A) TUNEL analyses of lateral sections of E8.5 Gcn5+/+, Gcn5hat/hat, and Gcn5−/− embryos, as indicated. Boxed regions are shown at higher magnification in the insets. Both larger (top right panel) and smaller (bottom right panel) Gcn5hat/hat embryos are shown. Few TUNEL-positive cells are observed in the wild-type or larger Gcn5hat/hat embryos, whereas increased numbers of apoptotic cells are observed in the Gcn5−/− (bottom left panel) and smaller Gcn5hat/hat embryos. hd, head fold; hrt, heart; so, somite. (B) Immunohistochemistry to detect activated caspase 3 in sections of Gcn5+/+ or larger Gcn5hat/hat E8.5 embryos. Boxed regions are shown at higher magnifications in the bottom panels to show the few positive cells observed. As described above, only low levels of apoptotic cells are observed in either type of embryo.
FIG. 7.
FIG. 7.
Proliferation of Gcn5hat/hat cells. (A) Immunohistochemistry to detect phosphorylated H3 serine 10, which marks mitotic cells, to monitor cell proliferation in E8.5 Gcn5+/+ and Gcn5hat/hat embryos. No obvious differences in the numbers of mitotic cells were observed. (B) Equal numbers (1 × 10⁵) of MEFs isolated from E13.5 Gcn5+/+, Gcn5hat/+, or Gcn5hat/hat embryos (as indicated) were plated after the third passage (day 0) and counted daily for 6 days (days 1 to 6) in duplicate to monitor the rate of cell division. Error bars indicate standard deviations from the means. (C) Flow cytometry profiles of propidium iodide-stained MEFs of the indicated genotypes at the indicated passage numbers. G1 cells, S-phase cells, and G2 cells are shown. (D) Flow cytometry profiles of cells stained with propidium iodide (PI) and annexin V antisera to detect live cells (annexin V and PI negative [hatched bars]) and cells in early (annexin V positive, PI negative [gray bars]) or late (annexin V and PI positive [white bars]) stages of apoptosis. The passage numbers are as indicated in panel C.
FIG. 8.
FIG. 8.
Neural tube closure defects are limited to the cranial region of Gcn5hat/hat embryos. (A) Scanning electron micrographs showing dorsal views of E9.5 wild-type or Gcn5hat/hat embryos. The neural tube is completely closed in the wild-type embryo, but it is open from the hindbrain-cervical boundary forward towards the forebrain in the Gcn5hat/hat embryo. (B) Hematoxylin-and-eosin-stained lateral sections of wild-type and Gcn5hat/hat embryos at E11.5 reveal severe morphological changes in the regions of the metencephalon, mesencephalon, and telecephalon in the mutant embryo. Bar, 430 μm.
FIG. 9.
FIG. 9.
Normal expression of developmental markers in Gcn5hat/hat embryos. Whole-mount in situ hybridizations were performed on E8.5 to E9.0 embryos using probes for the indicated genes. In each panel, the embryo on the right is Gcn5hat/hat, and the embryo on the left is a wild-type or heterozygous littermate. The arrow in panel C points to En-1 expression in the midbrain. The arrow in panel D points to Shh expression in the midline of the embryo.

Similar articles

Cited by

References

    1. Barlev, N. A., L. Liu, N. H. Chehab, K. Mansfield, K. G. Harris, T. D. Halazonetis, and S. L. Berger. 2001. Acetylation of p53 activates transcription through recruitment of coactivators/histone acetyltransferases. Mol. Cell 8:1243-1254. - PubMed
    1. Brand, M., C. Leurent, V. Mallouh, L. Tora, and P. Schultz. 1999. Three-dimensional structures of the TAFII-containing complexes TFIID and TFTC. Science 286:2151-2153. - PubMed
    1. Brand, M., J. G. Moggs, M. Oulad-Abdelghani, F. Lejeune, F. J. Dilworth, J. Stevenin, G. Almouzni, and L. Tora. 2001. UV-damaged DNA-binding protein in the TFTC complex links DNA damage recognition to nucleosome acetylation. EMBO J. 20:3187-3196. - PMC - PubMed
    1. Brand, M., K. Yamamoto, A. Staub, and L. Tora. 1999. Identification of TATA-binding protein-free TAFII-containing complex subunits suggests a role in nucleosome acetylation and signal transduction. J. Biol. Chem. 274:18285-18289. - PubMed
    1. Brownell, J. E., J. Zhou, T. Ranalli, R. Kobayashi, D. G. Edmondson, S. Y. Roth, and C. D. Allis. 1996. Tetrahymena histone acetyltransferase A: a homolog to yeast Gcn5p linking histone acetylation to gene activation. Cell 84:843-851. - PubMed

Publication types

MeSH terms

  NODES
Note 1
twitter 2