. 2007 Oct 1;584(Pt 1):245-59.
doi: 10.1113/jphysiol.2007.139840. Epub 2007 Jul 26.

Coordinated release of nucleotides and mucin from human airway epithelial Calu-3 cells

Affiliations

Coordinated release of nucleotides and mucin from human airway epithelial Calu-3 cells

Silvia M Kreda et al. J Physiol. .

Abstract

The efficiency of the mucociliary clearance (MCC) process that removes noxious materials from airway surfaces depends on the balance between mucin secretion, airway surface liquid (ASL) volume, and ciliary beating. Effective mucin dispersion into ASL requires salt and water secretion onto the mucosal surface, but how mucin secretion rate is coordinated with ion and, ultimately, water transport rates is poorly understood. Several components of MCC, including electrolyte and water transport, are regulated by nucleotides in the ASL interacting with purinergic receptors. Using polarized monolayers of airway epithelial Calu-3 cells, we investigated whether mucin secretion was accompanied by nucleotide release. Electron microscopic analyses of Calu-3 cells identified subapical granules that resembled goblet cell mucin granules. Real-time confocal microscopic analyses revealed that subapical granules, labelled with FM 1-43 or quinacrine, were competent for Ca(2+)-regulated exocytosis. Granules containing MUC5AC were apically secreted via Ca(2+)-regulated exocytosis as demonstrated by combined immunolocalization and slot blot analyses. In addition, Calu-3 cells exhibited Ca(2+)-regulated apical release of ATP and UDP-glucose, a substrate of glycosylation reactions within the secretory pathway. Neither mucin secretion nor ATP release from Calu-3 cells were affected by activation or inhibition of the cystic fibrosis transmembrane conductance regulator. In SPOC1 cells, an airway goblet cell model, purinergic P2Y(2) receptor-stimulated increase of cytosolic Ca(2+) concentration resulted in secretion of both mucins and nucleotides. Our data suggest that nucleotide release is a mechanism by which mucin-secreting goblet cells produce paracrine signals for mucin hydration within the ASL.


Figures

Figure 1
Figure 1. Calu-3 cells express goblet cell-like mucin granules
EM micrograph of a Calu-3 cell monolayer displaying ∼1 μm diameter dense-core electron-translucent granules; the area within the frame is shown at higher magnification in the right panel; bar, 1 μm.
Figure 2
Figure 2. Real-time exocytosis of FM 1-43-labelled granules
Calu-3 cell granules were preloaded with FM 1-43 and monitored by confocal microscopy analysis as described in the Methods. Cells were challenged with vehicle (CONT), 10 μm ionomycin in 1.6 mm (IONO) or 0 extracellular Ca2+ (0 Ca), 10 μm forskolin (FSK), 10 μm ionomycin in the presence of 5 μm cytochalasin D (CYTD) or 1 μm thapsigargin (THAP). A, identical xy focal plane illustrating cells at time 0 and after 5 min of ionomycin treatment; bar, 2 μm. Insets, confocal DIC plane corresponding to the area delimited by a white rectangle in the fluorescence panel, encompassing at least one cell; asterisks indicate the same position in all panels; bar, 2 μm. Note, after ionomycin treatment, loss of fluorescence in the red channel is accompanied by absence of granule images in the DIC channel. B, identical galvo-stage xz focal plane displaying subapical localization of fluorescent granules, before and after 10 s and 5 min of ionomycin treatment. Arrowheads indicate plasma membrane position; asterisks denote single fluorescent granules that loose fluorescence after 10 s of ionomycin treatment; bar, 20 μm. C, Quantification of changes in overall granule-associated fluorescence over time in cells incubated with indicated agents. Fluorescence changes associated with all 1 μm granules (relative to time 0, i.e. 100%) are expressed as mean ±s.e.m. Similar results were obtained in at least three experiments performed in duplicate.
Figure 3
Figure 3. Mucin expression in Calu-3 cells
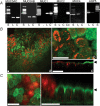
A, RT-PCR analysis of mRNA extracts from Calu-3 cells, and human lung and colon using specific primers for the indicated transcripts (see Methods). Brackets indicate the 500 bp DNA standard band. S, standard DNA ladder; L, lung; C, Calu-3 cells; Co, colon; (–), none. B, confocal microscopy analysis of Calu-3 cells co-immunostained with monoclonal and polyclonal antibodies against MUC5AC (45M1, red) and MUC1 (green), respectively. In face (xy scanning) confocal microscopy images at low magnification (a) and high resolution (b) of the uppermost 3 μm of the cell are shown. c, galvo-stage xz scanning of a monolayer illustrating that MUC5AC staining (red) is associated with ∼1 μm diameter granules localized towards the cell apex; bar, 20 μm. C, confocal microscopy xy (left) and xz (right) images of Calu-3 cells co-immunostained with monoclonal antibody 769 against human CFTR (green) and a polyclonal MUC5AC antibody (MAN-5AC1, red). CFTR is expressed in the apical membrane of most cells, except in those exhibiting MUC5AC immunostaining. Note, the MAN-5AC1 polyclonal antibody reacts against ‘relaxed’ MUC5AC from granules disrupted using the current fixation/permeabilization conditions. Arrowheads indicate plasma membrane position; bar, 20 μm.
Figure 4
Figure 4. Regulated exocytosis of MUC5AC from Calu-3 cells
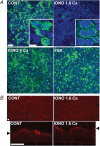
Calu-3 cells were stimulated for 10 min with either, vehicle (CONT), 10 μm forskolin (FSK) or 10 μm ionomycin (IONO) in 1.6 mm or 0 extracellular Ca2+, and were promptly fixed for immunostaining as in Fig. 3B. A, confocal microscopy xy images illustrating immunostaining with a MUC5AC monoclonal antibody (45M1, green). Insets, 3-dimensional reconstruction of a high-resolution xy confocal microscopy scanning of multiple planes comprising the whole cell. MUC5AC signal is associated with granules in control conditions (left), and non-granular structures following ionomycin addition (right; the green channel was enhanced to reveal MUC5AC staining in detail). Nuclei were stained with DAPI (blue); bar, 40 μm; inset bar, 8 μm. B, confocal microscopy images obtained by xy (upper panels) and xz galvo-stage (lower panels) scanning depicting immunostaining with a MUC1 polyclonal antibody (red); arrowheads indicate plasma membrane position; bar, 20 μm.
Figure 5
Figure 5. Secretion of MUC5AC and lysozyme from Calu-3 cells
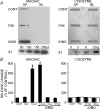
Aliquots from lumenal and basolateral baths from the experiments described in Fig. 4 were analysed by a slot blot immunodetection-based assay using 45M1 MUC5AC antibody, as indicated in the Methods. A, representative slot blot results of mucosal (AP) and basolateral (BL) samples from cells incubated with vehicle (CONT), forskolin (FSK) or ionomycin (IONO) (see Fig. 4 for details). For calibration, immunoreactivity displayed by the indicated volume of a MUC5AC-rich sample (purified MUC5AC standard was unavailable) and the indicated amount of a lysozyme standard is shown (ST). B, digital densitometry analysis of slot blots indicating changes in MUC5AC and lysozyme secretions in the mucosal (filled bars) and basolateral (open bars) baths of cells incubated under the indicated conditions. Thapsigargin (THAP, 1 μm) was added for 10 min, and cytochalasin D (CYTD, 5 μm) was added for 30 min before ionomycin addition. The results are expressed as percentage change relative to control samples (control, 100%), and are expressed as the mean ±s.e.m. from at least three experiments performed in quadruplicate; *P < 0.01.
Figure 6
Figure 6. Real-time assessment of Ca2+-promoted ATP release
Polarized Calu-3 cells were incubated in the presence of a 28-μm high mucosal film (50 μl well−1, 44 μl cm−2) containing the luciferin–luciferase cocktail. A, ATP was assessed in real-time in response to 5 μm ionomycin, 1 μm thapsigargin or 10 μm forskolin. B, quantitative illustration of mucosal ATP released from Calu-3 cells in response to 5 μm ionomycin added to cells in the presence of either 0 Ca2+ or 1.6 mm CaCl2, or after a 30 min preincubation with 10 μm BAPTA (in 0 Ca2+), 4 μm bafilomycin A1 (BAFI), 5 μm cytochalasin D (CYTD) or 10 μm CFTRinh-172. The data indicate percentage changes in ATP levels (at peak values) relative to changes with ionomycin in 1.6 mm CaCl2 (100%). The data are expressed as the mean ±s.d. from one experiment performed with quadruplicate samples. Similar results were obtained with n= 2–5 independent experiments. C, representative tracing of measurements of short circuit current (Isc) in Calu-3 cells illustrating forskolin (10 μm)-promoted Cl secretion and its inhibition by 10 μm CFTRinh-172.
Figure 7
Figure 7. Exocytosis of quinacrine-labelled granules
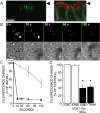
Calu-3 cell monolayers grown on glass coverslips were loaded with quinacrine and monitored by confocal microscopy (see Methods). A, image composition of equivalent xz galvo-stage confocal microscopy recordings. Left, live Calu-3 cells displaying subapical quinacrine fluorescent granules. Right, to verify polarized morphology of Calu-3 cell monolayers grown on glass substrate, fixed cells were co-immunostained for syntaxins 3 (red) and 4 (green), which are selectively expressed in the apical and basolateral compartments of polarized epithelial cells, respectively. Arrowheads indicate the position of the apical plasma membrane; bar, 5 μm. B, time course of Ca2+-promoted loss of quinacrine fluorescence in a single cell. Cells were preincubated for 15 min in the presence of 10 μm ionomycin and 0 Ca2+, and images were taken just before (0 s) and after the addition of 1.6 mm CaCl2. Upper and lower images depict an identical xy scanning focal plane (within the uppermost 3 μm of the cell) in the fluorescence and DIC channels (to identify granule position), respectively. Arrowheads indicate a granule displaying a fast fluorescence loss kinetics (i.e. loss of 90% of initial fluorescence at 10 s post stimulation); bar, 5 μm. C, data represent relative loss of fluorescence from individual granules (n= 10) displaying either fast (∼10 s, ♦) or slow (> 2 min, □) fluorescence loss kinetics. The results are expressed as the mean ±s.e.m. and are representative of two independent experiments performed in duplicate. D, quantification of overall granule-associated quinacrine fluorescence changes after 5 min treatment with vehicle (CONT, 100%), ionomycin (IONO) in either 0 or 1.6 mm extracellular Ca2+, or 1 μm thapsigargin (THAP). The data depict the mean ±s.e.m. of all granules recorded in two experiments performed with duplicate samples. *P < 0.01.
Figure 8
Figure 8. Vectorial release of adenine nucleotides and UDP-glucose (UDP-Glc) in polarized Calu-3 cells
Cells were preincubated for 90 min in Hank's balanced salt solution followed by the bilateral addition of 5–10 μm ionomycin (filled bars) or vehicle (open bars). Incubations continued for an additional 5 min, and the resulting adenyl purines (A) and UDP-Glc (B) released into the extracellular solutions were quantified as described in the Methods. UMP (300 μm) was added to mucosal solutions, as indicated. The data represent the mean ±s.d. from at least three experiments performed in triplicate. *P= 0.01.
Figure 9
Figure 9. P2Y2 receptor-promoted mucin secretion and nucleotide release in goblet-like SPOC1 cells
Cells were incubated for 30 min with 300 μm ATP (A and C) or UTP (B) and vehicle (A and C) or the P2Y2 receptor-inactive nucleotide GTP (300 μm, B). The results represent the mean ±s.d. from one experiment performed in quadruplicate, and reproduced in at least two independent experiments. UDP-glucose and adenyl purines were assessed as described in Fig. 8 and mucins were measured by an enzyme-linked lectin assay as described in the Methods.

Similar articles

Cited by

References

    1. Abbracchio MP, Burnstock G, Boeynaems JM, Barnard EA, Boyer JL, Kennedy C, Knight GE, Fumagalli M, Gachet C, Jacobson KA, Weisman GA. International Union of Pharmacology LVIII: update on the P2Y G protein-coupled nucleotide receptors: from molecular mechanisms and pathophysiology to therapy. Pharmacol Rev. 2006;58:281–341. - PMC - PubMed
    1. Abdullah LH, Conway JD, Cohn JA, Davis CW. Protein kinase C and Ca2+ activation of mucin secretion in airway goblet cells. Am J Physiol Lung Cell Mol Physiol. 1997;273:L201–L210. - PubMed
    1. Bankston LA, Guidotti G. Characterization of ATP transport into chromaffin granule ghosts – synergy of ATP and serotonin accumulation in chromaffin granule ghosts. J Biol Chem. 1996;271:17132–17138. - PubMed
    1. Berger JT, Voynow JA, Peters KW, Rose MC. Respiratory carcinoma cell lines. MUC genes and glycoconjugates. Am J Respir Cell Mol Biol. 1999;20:500–510. - PubMed
    1. Bodin P, Burnstock G. Evidence that release of adenosine triphosphate from endothelial cells during increased shear stress is vesicular. J Cardiovasc Pharmacol. 2001;38:900–908. - PubMed

Publication types

LinkOut - more resources

  NODES
INTERN 1
Note 3
twitter 2
Verify 1