Live-cell transforms between Ca2+ transients and FRET responses for a troponin-C-based Ca2+ sensor
- PMID: 17704158
- PMCID: PMC2084226
- DOI: 10.1529/biophysj.107.109629
Live-cell transforms between Ca2+ transients and FRET responses for a troponin-C-based Ca2+ sensor
Abstract
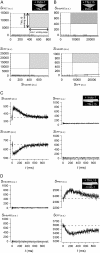
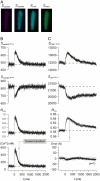
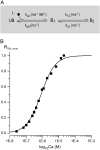
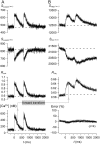
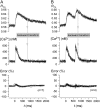
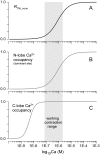
Genetically encoded Ca(2+) sensors promise sustained in vivo detection of Ca(2+) signals. However, these sensors are sometimes challenged by inconsistent performance and slow/uncertain kinetic responsiveness. The former challenge may arise because most sensors employ calmodulin (CaM) as the Ca(2+)-sensing module, such that interference via endogenous CaM may result. One class of sensors that could minimize this concern utilizes troponin C as the Ca(2+) sensor. Here, we therefore probed the reliability and kinetics of one representative of this class (cyan fluorescence protein/yellow fluorescent protein-fluorescence resonance energy transfer (FRET) sensor TN-L15) within cardiac ventricular myocytes. These cells furnished a pertinent live-cell test environment, given substantial endogenous CaM levels and fast reproducible Ca(2+) transients for testing sensor kinetics. TN-L15 was virally expressed within myocytes, and Indo-1 acutely loaded to monitor "true" Ca(2+) transients. This configuration permitted independent and simultaneous detection of TN-L15 and Indo-1 signals within individual cells. The relation between TN-L15 FRET responses and Indo-1 Ca(2+) transients appeared reproducible, though FRET signals were delayed compared to Ca(2+) transients. Nonetheless, a three-state mechanism sufficed to map between measured Ca(2+) transients and actual TN-L15 outputs. Overall, reproducibility of TN-L15 dynamics, coupled with algorithmic transforms between FRET and Ca(2+) signals, renders these sensors promising for quantitative estimation of Ca(2+) dynamics in vivo.
Figures
Similar articles
-
Fluorescence lifetime readouts of Troponin-C-based calcium FRET sensors: a quantitative comparison of CFP and mTFP1 as donor fluorophores.PLoS One. 2012;7(11):e49200. doi: 10.1371/journal.pone.0049200. Epub 2012 Nov 9. PLoS One. 2012. PMID: 23152874 Free PMC article.
-
A FRET-based calcium biosensor with fast signal kinetics and high fluorescence change.Biophys J. 2006 Mar 1;90(5):1790-6. doi: 10.1529/biophysj.105.073536. Epub 2005 Dec 9. Biophys J. 2006. PMID: 16339891 Free PMC article.
-
Confocal FLIM of genetically encoded FRET sensors for quantitative Ca2+ imaging.Cold Spring Harb Protoc. 2014 Dec 1;2014(12):1328-32. doi: 10.1101/pdb.prot077040. Cold Spring Harb Protoc. 2014. PMID: 25447281
-
Troponin C-based biosensors: a new family of genetically encoded indicators for in vivo calcium imaging in the nervous system.Cell Calcium. 2007 Oct-Nov;42(4-5):351-61. doi: 10.1016/j.ceca.2007.02.011. Epub 2007 Apr 23. Cell Calcium. 2007. PMID: 17451806 Review.
-
FRET-based genetically-encoded sensors for quantitative monitoring of metabolites.Biotechnol Lett. 2015 Oct;37(10):1919-28. doi: 10.1007/s10529-015-1873-6. Epub 2015 Jul 17. Biotechnol Lett. 2015. PMID: 26184603 Review.
Cited by
-
Deep-prior ODEs augment fluorescence imaging with chemical sensors.Nat Commun. 2024 Oct 24;15(1):9172. doi: 10.1038/s41467-024-53232-2. Nat Commun. 2024. PMID: 39448575 Free PMC article.
-
Characterization of PDGF-Induced Subcellular Calcium Regulation through Calcium Channels in Airway Smooth Muscle Cells by FRET Biosensors.Biosensors (Basel). 2024 Apr 7;14(4):179. doi: 10.3390/bios14040179. Biosensors (Basel). 2024. PMID: 38667172 Free PMC article.
-
Fluorescent biosensor imaging meets deterministic mathematical modelling: quantitative investigation of signalling compartmentalization.J Physiol. 2023 Oct;601(19):4227-4241. doi: 10.1113/JP282696. Epub 2023 Sep 25. J Physiol. 2023. PMID: 37747358 Free PMC article. Review.
-
Fast and sensitive GCaMP calcium indicators for imaging neural populations.Nature. 2023 Mar;615(7954):884-891. doi: 10.1038/s41586-023-05828-9. Epub 2023 Mar 15. Nature. 2023. PMID: 36922596 Free PMC article.
-
Genetically Encoded Fluorescent Biosensors Illuminate the Spatiotemporal Regulation of Signaling Networks.Chem Rev. 2018 Dec 26;118(24):11707-11794. doi: 10.1021/acs.chemrev.8b00333. Epub 2018 Dec 14. Chem Rev. 2018. PMID: 30550275 Free PMC article. Review.
References
-
- Berridge, M. J., M. D. Bootman, and H. L. Roderick. 2003. Calcium signalling: dynamics, homeostasis and remodelling. Nat. Rev. Mol. Cell Biol. 4:517–529. - PubMed
-
- Bers, D. M. 2001. Excitation-Contraction Coupling and Cardiac Contractile Force. Kluwer, Boston.
-
- Deisseroth, K., H. Bito, and R. W. Tsien. 1996. Signaling from synapse to nucleus: postsynaptic CREB phosphorylation during multiple forms of hippocampal synaptic plasticity. Neuron. 16:89–101. - PubMed
-
- Liang, H., C. D. DeMaria, M. G. Erickson, M. X. Mori, B. A. Alseikhan, and D. T. Yue. 2003. Unified mechanisms of Ca2+ regulation across the Ca2+ channel family. Neuron. 39:951–960. - PubMed
-
- Grynkiewicz, G., M. Poenie, and R. Y. Tsien. 1985. A new generation of Ca2+ indicators with greatly improved fluorescence properties. J. Biol. Chem. 260:3440–3450. - PubMed
Publication types
MeSH terms
Substances
Grants and funding
LinkOut - more resources
Full Text Sources
Research Materials
Miscellaneous

