Differential expression of the TFIIIA regulatory pathway in response to salt stress between Medicago truncatula genotypes
- PMID: 17951460
- PMCID: PMC2151693
- DOI: 10.1104/pp.107.106146
Differential expression of the TFIIIA regulatory pathway in response to salt stress between Medicago truncatula genotypes
Abstract
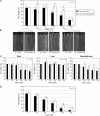
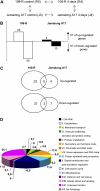
Soil salinity is one of the most significant abiotic stresses for crop plants, including legumes. These plants can establish root symbioses with nitrogen-fixing soil bacteria and are able to grow in nitrogen-poor soils. Medicago truncatula varieties show diverse adaptive responses to environmental conditions, such as saline soils. We have compared the differential root growth of two genotypes of M. truncatula (108-R and Jemalong A17) in response to salt stress. Jemalong A17 is more tolerant to salt stress than 108-R, regarding both root and nodulation responses independently of the nitrogen status of the media. A dedicated macroarray containing 384 genes linked to stress responses was used to compare root gene expression during salt stress in these genotypes. Several genes potentially associated with the contrasting cellular responses of these plants to salt stress were identified as expressed in the more tolerant genotype even in the absence of stress. Among them, a homolog of the abiotic stress-related COLD-REGULATEDA1 gene and a TFIIIA-related transcription factor (TF), MtZpt2-1, known to regulate the former gene. Two MtZpt2 TFs (MtZpt2-1 and MtZpt2-2) were found in Jemalong A17 plants and showed increased expression in roots when compared to 108-R. Overexpression of these TFs in the sensitive genotype 108-R, but not in Jemalong A17, led to increased root growth under salt stress, suggesting a role for this pathway in the adaptive response to salt stress of these M. truncatula genotypes.
Figures


Similar articles
-
Identification of regulatory pathways involved in the reacquisition of root growth after salt stress in Medicago truncatula.Plant J. 2007 Jul;51(1):1-17. doi: 10.1111/j.1365-313X.2007.03117.x. Epub 2007 May 3. Plant J. 2007. PMID: 17488237
-
Comparative transcriptomic analysis of salt adaptation in roots of contrasting Medicago truncatula genotypes.Mol Plant. 2012 Sep;5(5):1068-81. doi: 10.1093/mp/sss009. Epub 2012 Mar 14. Mol Plant. 2012. PMID: 22419822
-
Overexpression of the arginine decarboxylase gene promotes the symbiotic interaction Medicago truncatula-Sinorhizobium meliloti and induces the accumulation of proline and spermine in nodules under salt stress conditions.J Plant Physiol. 2019 Oct;241:153034. doi: 10.1016/j.jplph.2019.153034. Epub 2019 Aug 27. J Plant Physiol. 2019. PMID: 31493718
-
How rhizobial symbionts invade plants: the Sinorhizobium-Medicago model.Nat Rev Microbiol. 2007 Aug;5(8):619-33. doi: 10.1038/nrmicro1705. Nat Rev Microbiol. 2007. PMID: 17632573 Free PMC article. Review.
-
Leguminous plants: inventors of root nodules to accommodate symbiotic bacteria.Int Rev Cell Mol Biol. 2015;316:111-58. doi: 10.1016/bs.ircmb.2015.01.004. Epub 2015 Feb 20. Int Rev Cell Mol Biol. 2015. PMID: 25805123 Review.
Cited by
-
Opposing Control by Transcription Factors MYB61 and MYB3 Increases Freezing Tolerance by Relieving C-Repeat Binding Factor Suppression.Plant Physiol. 2016 Oct;172(2):1306-1323. doi: 10.1104/pp.16.00051. Epub 2016 Aug 30. Plant Physiol. 2016. PMID: 27578551 Free PMC article.
-
Comparative Physiological and Transcriptional Analyses of Two Contrasting Drought Tolerant Alfalfa Varieties.Front Plant Sci. 2016 Jan 12;6:1256. doi: 10.3389/fpls.2015.01256. eCollection 2015. Front Plant Sci. 2016. PMID: 26793226 Free PMC article.
-
Salinity stress response and 'omics' approaches for improving salinity stress tolerance in major grain legumes.Plant Cell Rep. 2019 Mar;38(3):255-277. doi: 10.1007/s00299-019-02374-5. Epub 2019 Jan 12. Plant Cell Rep. 2019. PMID: 30637478 Review.
-
Genome variations account for different response to three mineral elements between Medicago truncatula ecotypes Jemalong A17 and R108.BMC Plant Biol. 2014 May 6;14:122. doi: 10.1186/1471-2229-14-122. BMC Plant Biol. 2014. PMID: 24885873 Free PMC article.
-
The F-box family genes as key elements in response to salt, heavy mental, and drought stresses in Medicago truncatula.Funct Integr Genomics. 2015 Jul;15(4):495-507. doi: 10.1007/s10142-015-0438-z. Epub 2015 Apr 16. Funct Integr Genomics. 2015. PMID: 25877816
References
-
- Apse MP, Aharon GS, Snedden WA, Blumwald E (1999) Salt tolerance conferred by overexpression of a vacuolar Na+/H+ antiport in Arabidopsis. Science 285 1256–1258 - PubMed
-
- Arrese-Igor C, González E, Gordon A, Minchin F, Gálvez L, Royuela M, Cabrerizo P, Aparicio-Tejo P (1999) Sucrose synthase and nodule nitrogen fixation under drought and environmental stresses. Symbiosis 27 189–212
-
- Assmann S, Wang X (2001) From milliseconds to millions of years: guard cells and environmental responses. Plant Biol 4 421–428 - PubMed
-
- Austin RB (1993) Augmenting yield-based selection. In MD Hayward, I Romagosa, eds, Plant Breeding Principles and Prospects. Chapman and Hall, London, pp 391–405
-
- Barker DG, Bianchi S, Blondon F, Dattée Y, Duc G, Essad S, Flament P, Gallusci P, Génier G, Guy P, et al (1990) Medicago truncatula, a model plant for studying the molecular genetics of the Rhizobium-legume symbiosis. Plant Mol Biol Rep 8 40–49
Publication types
MeSH terms
Substances
LinkOut - more resources
Full Text Sources
Miscellaneous

