. 2008 Mar;15(3):268-79.
doi: 10.1038/nsmb.1399. Epub 2008 Mar 2.

A mammalian microRNA cluster controls DNA methylation and telomere recombination via Rbl2-dependent regulation of DNA methyltransferases

Affiliations

A mammalian microRNA cluster controls DNA methylation and telomere recombination via Rbl2-dependent regulation of DNA methyltransferases

Roberta Benetti et al. Nat Struct Mol Biol. 2008 Mar.

Erratum in

  • Nat Struct Mol Biol. 2008 Sep;15(9):998

Abstract

Dicer initiates RNA interference by generating small RNAs involved in various silencing pathways. Dicer participates in centromeric silencing, but its role in the epigenetic regulation of other chromatin domains has not been explored. Here we show that Dicer1 deficiency in Mus musculus leads to decreased DNA methylation, concomitant with increased telomere recombination and telomere elongation. These DNA-methylation defects correlate with decreased expression of Dnmt1, Dnmt3a and Dnmt3b DNA methyltransferases (Dnmts), and methylation levels can be recovered by their overexpression. We identify the retinoblastoma-like 2 protein (Rbl2) as responsible for decreased Dnmt expression in Dicer1-null cells, suggesting the existence of Dicer-dependent small RNAs that _target Rbl2. We identify the miR-290 cluster as being downregulated in Dicer1-deficient cells and show that it silences Rbl2, thereby controlling Dnmt expression. These results identify a pathway by which miR-290 directly regulates Rbl2-dependent Dnmt expression, indirectly affecting telomere-length homeostasis.


Figures
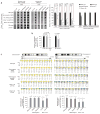
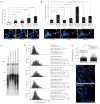
Figure 1
Figure 1
Defective DNA methylation in Dicer1-null cells. (a) 5-methyl cytosine (5MetCyt) abundance after chromatin immunoprecipitation (ChIP) with antibodies to the substrates indicated above the blots. Values were corrected by the abundance of these marks at pericentric repeats (left). Dnmt1/ cells were used as a control. AcH3K9, acetylated H3 lysine 9; H4K20me3, trimethylated histone H3 lysine 20; H3K9me3, trimethylated histone H3 lysine 9; Het., heterozygous; HP1, heterochromatin protein 1. (b) Fraction of methylated B1 SINE repeat element in the indicated genotypes. Dnmt1/ cells were used as control. WT, wild type. (c) Abundance of methylated CpG dinucleotides as determined by bisulfite sequencing. We analyzed 9–16 clones per genotype. Yellow and blue represent the frequency of methylated and unmethylated CpG dinucleotides, respectively. Grey corresponds to undetermined methylation. CpG, CpG position; U, unmethylated; M, methylated; NP, not present. Statistically significant differences are indicated with an asterisk.
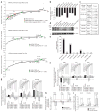
Figure 2
Figure 2
Defective DNA methylation of Dicer1-null cells is corrected by Dnmt overexpression. (a) Quantification of Dnmt mRNA levels. (b) Representative western blots. Dnmt1- and Dnmt3a,3b-deficient cells were used as negative controls and Dnmt3a,3b-deficient cells were reconstituted with the Dnmt3a enzyme (Dnmt3a,3b/* Dnmt3a) as a control for Dnmt3a mobility in the gel. (c) Quantification of western blot results shown in part b. (d) Dnmt mRNA levels before or after expression of the indicated enzymes. (e) Fraction of methylated B1 SINE repeat element in two Dicer1-null cultures (27H10 and 27G5) before and after Dnmt overexpression. (f) Percentage of CpG methylation at the indicated subtelomeres before and after overexpression of the indicated Dnmts. Bisulfite sequencing of 2–16 individual clones was performed.
Figure 3
Figure 3
Increased telomere recombination and aberrantly elongated telomeres in Dicer1-null cells. (a) Quantification of telomere recombination events (T-SCE) in the indicated genotypes. Error bars correspond to two or three independent experiments (n). The total number of T-SCE out of the total number of chromosomes analyzed per genotype is indicated. Representative chromosome orientation fluorescence in situ hybridization (CO-FISH) images after labeling leading (green) and lagging (red) strand telomeres are shown below. A T-SCE was considered positive only when observed with both probes and involving an unequal exchange of fluorescence (yellow arrows). Het., heterozygous (b) Quantification of T-SCE in the indicated genotypes before and after overexpression of Dnmt1 or Dnmt3a,3b. The experiment was performed in duplicate using two independent Dicer1-null cultures (27G5 and 27H10). The total number of T-SCE out of the total number of chromosomes analyzed per genotype is indicated. The results are not directly comparable to those shown in part a, as they correspond to different experiments. T-SCE events are indicated with yellow arrows. (c) Telomere restriction fragment (TRF) analysis in the indicated ES cells. (d) Telomere-length distribution in the indicated ES cells as determined by quantitative FISH (Q-FISH). p refers to the passage number of the ES cells. The vertical red lines highlight the longer and more widely scattered telomeres of Dicer1-heterozygous and Dicer1-null cells compared to wild-type controls. (e) Quantification of telomere fluorescence in tail skin sections of the indicated genotypes. More than 100 keratinocyte nuclei and 2,000 telomere dots per genotype were analyzed. a.u.f., arbitrary units of fluorescence. (f) Representative images of telomere fluorescence in skin sections from wild-type and Dicer1-null mice.
Figure 4
Figure 4
Decreased telomerase activity and normal expression of telomere-binding proteins in the absence of Dicer. (a) Expression levels of the indicated telomerase components in wild-type and Dicer1-null ES cells using Agilent 4×44K mouse 60-mer oligonucleotide microarrays. Data are mean values from two experiments using cells derived from two independent Dicer1-null cultures (27G5 and 27H10). Statistical significance using the Student’s t-test is also indicated. Note the absence of significant differences between genotypes. (b) Expression levels of the indicated telomere-binding proteins determined as in part a. Statistical significance using the Student’s t-test is indicated. (c) Representative western blots showing the abundance of telomere repeat binding factors 1 and 2 (TRF1 and TRF2) in the indicated genotypes. Quantification is shown below. Statistical significance is indicated. NS, not significant. (d) Representative images of telomerase telomere repeat amplification protocol (TRAP) activity in the indicated genotypes are shown on the left. (+), treated with RNase; (–), not treated with RNase. Quantification of telomerase TRAP activity levels in the indicated genotypes is shown on the right. a.u., arbitrary units.
Figure 5
Figure 5
Dicer is not required to direct heterochromatic histone marks and HP1 binding at mammalian telomeres and subtelomeres. (a) Representative chromatin immunoprecipitation (ChIP) data of wild-type, Dicer1-heterozygous and Dicer1-null ES cells with the indicated antibodies. AcH3K9, acetylated H3 lysine 9; H4K20me3, trimethylated histone H3 lysine 20; H3K9me3, trimethylated histone H3 lysine 9; Het., heterozygous; HP1, heterochromatin protein 1. (b) Quantification of immunoprecipitated telomeric and pericentric repeats. In the case of telomeric chromatin, quantification was done after normalization to both telomeric and pericentric input signals. Error bars correspond to two to eight independent experiments (n = 2–8). Dicer1-null ES cells showed a significant increase in heterochromatic features at telomeric chromatin compared to wild-type controls, which was not detected at pericentric chromatin. Statistical significance values are shown.
Figure 6
Figure 6
Increased expression of Retinoblastoma (Rb) family proteins in Dicer1-null cells is responsible of the decreased expression of Dnmt1, Dnmt3a and Dnmt3b. (a) Gene-expression changes in the indicated genotypes using Agilent 4×44K mouse 60-mer oligonucleotide microarrays. Data are mean values from two experiments using two independent Dicer1-null cultures (27G5 and 27H10). Ablation of Dicer results in decreased Dnmt3a,3b expression. Expression of Dnmt1 was not detectable (n.d.) because of an extensive mismatch between the oligonucleotide probe on the array and Dnmt1 mRNA. (b) Downregulation of Dnmt3a,3b expression was paralleled by a significant increase in the expression of Rb family genes Rbl1 and Rbl2, and of the Rb regulators Rb1cc1, Rbak and Rbbp1. (c) Representative RT-PCR gel confirming overexpression of TAg (T121) in Dicer1-null cells. β-Actin is used as a control. (d) Dnmt1, Dnmt3a and Dnmt3b mRNA levels as determined by quantitative RT-PCR in Dicer1-null ES cells transfected with a control vector or a truncated form of the SV40 large T-antigen (T121). Inhibition of Rb function by TAg T121 in Dicer1-null cells significantly increases Dnmt1 and Dnmt3b expression. (e) Expression of TAg T121 in Dicer1-null ES cells rescues subtelomeric DNA-methylation defects as determined by bisulfite sequencing of 4–16 individual clones. (f) Histone acetylation (AcH3K9) as determined by ChIP at the promoters of Dnmt genes in the indicated genotypes. Dnmt1-deficient cells were used as negative control.
Figure 7
Figure 7
The miR-290 cluster _targets Rbl2 and controls Dnmt3a,3b expression. (a) Each data point represents the expression level of miRNAs in Dicer1-null compared to wild-type ES cells. miRNAs of the miRNA-290 cluster are indicated in orange; other miRNAs predicted to _target Rb family members are shown in green. MicroRNAs _targeting Rbl2, Rbl1 and Rb1 whose expression is significantly changed in the absence of Dicer are shown. (b) Ablation of Dicer causes decreased expression of all members of the miR-290 cluster. (c) Rb-related _targets of the miR-290 cluster in mouse and human cells. Arid4a, ARID domain–containing protein 4A; Rbbp, retinoblastoma binding protein. (d) Representative western blot showing Rbl2 expression after transfection with the indicated miRNAs. (Rb1/Rbl1/Rbl2)/ mouse embryonic fibroblasts were included as a negative control. (e) Quantification of the western blot shown in part d. Values were corrected by actin levels. (f) Decreased Rbl2 mRNA levels in C2C12 cells after transfection with the indicated miRNAs. No changes were observed in Rb1 or Rbl1 mRNAs. (g) Dnmt levels in C2C12 cells after transfection with the indicated miRNAs. (h) Expression of the indicated Rb proteins after transfection of the miR-290 cluster in Dicer1-null cells. (i) Dnmt levels in Dicer1-null cells after transfection with the indicated miRNAs. Only Dnmt3a and Dnmt3b were affected. Values were normalized to actin expression in parts fi.
Figure 8
Figure 8
A previously unknown miR-290–dependent pathway controls DNA methylation via Rbl2 and affects telomere integrity and telomere-length homeostasis. We identify here a regulatory pathway involving the highly conserved mammalian miR-290 cluster as an important post-transcriptional regulator of Rbl2, which in turn acts as a transcriptional repressor of Dnmt3a and Dnmt3b (a). In the absence of Dicer (b), miR-290 downregulation leads to increased levels of the miR-290 _target Rbl2, which in turn acts as a transcriptional repressor of Dnmt3a,3b expression. Decreased Dnmt expression leads to a hypomethylation of the genome, including the subtelomeric regions, and to the appearance of telomere phenotypes such as increased telomere recombination and aberrantly long telomeres.

Similar articles

Cited by

References

    1. Fukagawa T, et al. Dicer is essential for formation of the heterochromatin structure in vertebrate cells. Nat Cell Biol. 2004;6:784–791. - PubMed
    1. Kanellopoulou C, et al. Dicer-deficient mouse embryonic stem cells are defective in differentiation and centromeric silencing. Genes Dev. 2005;19:489–501. - PMC - PubMed
    1. Volpe TA, et al. Regulation of heterochromatic silencing and histone H3 lysine-9 methylation by RNAi. Science. 2002;297:1833–1837. - PubMed
    1. Hall IM, et al. Establishment and maintenance of a heterochromatin domain. Science. 2002;297:2232–2237. - PubMed
    1. Pal-Bhadra M, et al. Heterochromatic silencing and HP1 localization in Drosophila are dependent on the RNAi machinery. Science. 2004;303:669–672. - PubMed

Publication types

  NODES
Note 1
Project 1
twitter 2