. 2008 Aug 15;112(4):1493-502.
doi: 10.1182/blood-2008-02-137398. Epub 2008 Jun 6.

Ulk1 plays a critical role in the autophagic clearance of mitochondria and ribosomes during reticulocyte maturation

Affiliations

Ulk1 plays a critical role in the autophagic clearance of mitochondria and ribosomes during reticulocyte maturation

Mondira Kundu et al. Blood. .

Abstract

Production of a red blood cell's hemoglobin depends on mitochondrial heme synthesis. However, mature red blood cells are devoid of mitochondria and rely on glycolysis for ATP production. The molecular basis for the selective elimination of mitochondria from mature red blood cells remains controversial. Recent evidence suggests that clearance of both mitochondria and ribosomes, which occurs in reticulocytes following nuclear extrusion, depends on autophagy. Here, we demonstrate that Ulk1, a serine threonine kinase with homology to yeast atg1p, is a critical regulator of mitochondrial and ribosomal clearance during the final stages of erythroid maturation. However, in contrast to the core autophagy genes such as atg5 and atg7, expression of ulk1 is not essential for induction of macroautophagy in response to nutrient deprivation or for survival of newborn mice. Together, these data suggest that the ATG1 homologue, Ulk1, is a component of the selective autophagy machinery that leads to the elimination of organelles in erythroid cells rather that an essential mechanistic component of autophagy.


Figures

Figure 1
Figure 1
Induction of Ulk1 expression correlates with onset of autophagy and loss of mitochondria during terminal erythroid maturation. Erythroid maturation was examined using the FVA culture system described previously. (A) May-Grünwald and benzidine (inset) stains of splenic erythroblasts cultured in the presence of erythropoietin (EPO) for 1 hour (left panel) and 48 hours (center panel). The right panel shows the relative distribution of cells at various stages of erythroid maturation after 1, 24, 36, and 48 hours in culture from a representative experiment. Differentials were performed on more than 300 cells per time point. PE indicates proerythroblast; BE, basophilic erythroblast; PCE, polychromatophilic erythroblast; OCE, orthochromatic erythroblast; and retic, reticulocyte. (B) Quantitative RT-PCR (TaqMan, Applied Biosystems) analysis was performed in triplicate using RNA isolated from cells after 1, 24, 36, and 48 hours in culture. Levels of ulk1 and ulk2 mRNA were normalized to that of 18S RNA. The expression of ulk1 and ulk2 relative to levels in control 3T3 cells is shown in the graph. Error bars represent standard deviation. (C) Northern blot analysis of cells after 1, 24, 36, and 48 hours in culture using an ulk1 cDNA probe (bottom panel). The top panel shows levels of ribosomal RNA on an ethidium bromide–stained agarose gel. (D) Western blot analysis of cells after 1, 24, 36, and 48 hours in culture. (E) Quantitative RT-PCR (TaqMan) analysis was performed in triplicate using RNA isolated from cells after 1, 24, 36, and 48 hours in culture. Levels of lc3 RNA levels were normalized to 18S RNA. The graph shows lc3 RNA levels relative to the 1-hour time point. Error bars represent standard deviation. (F) Representative electron micrographs of autophagosomes containing mitochondria (highlighted by ➚) in a reticulocyte.
Figure 2
Figure 2
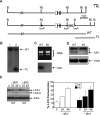
Generation of viable ulk1−/− mice without significant defect in autophagy. (A) The first panel shows the genomic organization of the 5′ end of the ulk1 gene. The second panel depicts the _targeting construct that introduces an ulk1 allele where loxP sites flank a 5.6-kb EcoRI fragment containing exons I to III. The third panel shows the expected sizes of the wild-type (WT) and floxed (FL) ulk1 alleles, following digestion of DNA with BamHI after probing with the 1-kb EcoRI-BamHI probe (indicated by the bar). (B) Southern blot analysis of BamHI digested DNA from representative wild-type (WT) and floxed (FL) ulk1 clones probed with the EcoRI-BamHI probe. This probe generates an approximately 19-kb fragment in WT mice, but as a result of cloning into to the loxP vector a BamHI restriction site is introduced that produces a 4.3-kb fragment in clones containing a homologously recombined floxed ulk1 allele. (C) Northern blot analysis of ulk1+/+ (WT) and ulk1−/− (KO) murine embryonic fibroblasts (MEFs). (D) Western blot analysis of ulk1+/+ (WT) and ulk1−/− (KO) MEFs. The asterisk (*) denotes nonspecific bands. (E) Western blot analysis of ulk1+/+ (WT) and ulk1−/− (KO) MEFs cultured in the presence (C) or absence of glucose (−gluc) for 24 or 48 hours. The experiment was performed in triplicate. Error bars represent standard deviation. Percentage LC3 conversion was calculated using the following formula: 100*LC3-I/total LC3.
Figure 3
Figure 3
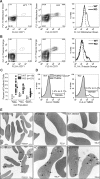
Retention of mitochondria in mature red blood cells of ulk1−/− mice. Peripheral blood from 21 ulk1+/+ (WT) and 19 ulk1−/− (KO) mice ranging in age from 8 weeks to 5 months was analyzed by fluorescence-activated cell sorting (FACS) analysis. (A) Representative contour plot of WT (left panel) and KO (center panel) cells stained with Mitotracker Green FM (y-axis) and CD71-PE (x-axis), with histogram (right panel) showing direct comparison of Mitotracker Green fluorescence (FL1) of the 2 populations (WT vs KO). (B) Representative contour plot of WT (left panel) and KO (center panel) cells stained with thiazole orange (y-axis) and CD71-PE (x-axis), with histogram (right) showing direct comparison of thiazole orange fluorescence (FL1) of the 2 populations. (C) Graph showing percentage of erythroid cells in individual WT and KO animals staining positively with Mitotracker Green FM (MG+), thiazole orange (TO+), and CD71 (CD71+). The population means and standard deviations (error bars) are graphically depicted and show the following statistically significant differences in percentage of Mitotracker Green–positive (3.7% ± 1.2% in WT vs 16.5% ± 6.4% in KO), thiazole orange–positive (7.0% ± 2.1% in WT vs 15.8% ± 4.4% in KO), and CD71+ (3.1% ± 1.2% in WT vs 8.0% ± 3.4% in KO) erythroid cells. Statistically significant differences (P < .001) between WT and KO populations were identified by Student t test analysis and are marked by an asterisk (*). (D) Representative histograms of WT (left panel) and KO (right panel) red blood cells stained with TMRM. The markers denote positive TMRM staining. Each TMRM-stained sample was split into 2 tubes, and the mitochondrial decoupler, CCCP, was added to one of the tubes immediately prior to analysis. The percentage of TMRM-positive cells before (1.4% in WT vs 13.2% in KO) and after (0.1% in WT vs 0.4% in KO) incubation in 50 μM CCCP is shown. (E) Representative electron micrographs of WT (top panel) and KO (bottom panel) red blood cells. ➚ point to intact mitochondria. Ribosomes are seen in a subset of the red cells (bottom right panel).
Figure 4
Figure 4
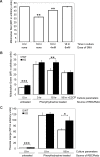
Ulk1 deficiency impairs mitochondrial clearance in reticulocytes. (A) Peripheral blood from wild-type phenylhydrazine-treated mice consisted of greater than 70% CD71+/Retic-Count–positive reticulocytes. The graph shows mean fluorescence intensity (MFI) of Mitotracker Red FM–stained cells at the start of the culture (0 hours) and after 18 hours in culture with or without the indicated doses of the autophagy inhibitor, 3-methyladenine (3-MA). (B) The graph shows mean fluorescence intensity (MFI) of Mitotracker Green–stained red blood cells from untreated (PBS-injected) and phenylhydrazine (PHZ)–treated ulk1+/+ (WT, n = 3 in each group) and ulk1−/− (KO, n = 3 in each group) mice at the start of the culture (0 hours) and PHZ treated after 18 hours in complete media with or without 50 μM CCCP. (C) The graph shows mean fluorescence intensity (MFI) of thiazole orange–stained samples described in panel B. Statistically significant differences between WT and KO populations were identified by Student t test analysis and are noted with asterisks: *P < .05; **P < .01; ***P < .005.
Figure 5
Figure 5
Increased mitochondrial mass in ulk1−/− murine embryonic fibroblasts (MEFs). (A) MEFs derived from ulk1+/+ (WT) and ulk1−/− (KO) were stained with Mitotracker Green FM and analyzed by FACS. The histogram shows the distribution of Mitotracker staining in both populations. Mean (n = 5) and standard deviation of the percentage of cells within the marker are shown. The marker was set to include all points above the intersection of the 2 plots to highlight the difference in staining between the 2 populations. (B) MEFs derived from ulk1+/+ (WT) and ulk1−/− (KO) were stained with TMRM. The histogram shows the distribution of TMRM staining in both populations before and after incubation with in 50 μM CCCP. Mean (n = 5) and standard deviation of the percentage of cells within the marker are shown. After treatment with CCCP mean FL2 fluorescence was reduced to 5.8 (± 0.3) in WT MEFs and 5.7 (± 0.1) in KO MEFs. (C) Graph showing citrate synthase activity in whole-cell extracts prepared from wild-type (WT) and Ulk1-deficient (KO) MEFs normalized to total protein. The mean (n = 5) and standard deviations are shown. Statistical significance (P < .01) was calculated by Student t test analysis and is marked with an asterisk (*). (D) Representative histogram showing forward scatter distribution of MEFs derived from ulk1+/+ (WT) and ulk1−/− (KO).

Similar articles

Cited by

References

    1. Geminard C, de Gassart A, Vidal M. Reticulocyte maturation: mitoptosis and exosome release. Biocell. 2002;26:205–215. - PubMed
    1. Pieczenik SR, Neustadt J. Mitochondrial dysfunction and molecular pathways of disease. Exp Mol Pathol. 2007;83:84–92. - PubMed
    1. Schewe T, Rapoport SM, Kuhn H. Enzymology and physiology of reticulocyte lipoxygenase: comparison with other lipoxygenases. Adv Enzymol Relat Areas Mol Biol. 1986;58:191–272. - PubMed
    1. van Leyen K, Duvoisin RM, Engelhardt H, Wiedmann M. A function for lipoxygenase in programmed organelle degradation. Nature. 1998;395:392–395. - PubMed
    1. Vijayvergiya C, De Angelis D, Walther M, et al. High-level expression of rabbit 15-lipoxygenase induces collapse of the mitochondrial pH gradient in cell culture. Biochemistry. 2004;43:15296–15302. - PubMed

Publication types

Substances

  NODES
INTERN 2
Note 3
twitter 2