Ethanol-related increases in degenerating bodies in the Purkinje neuron dendrites of aging rats
- PMID: 18559274
- PMCID: PMC2586423
- DOI: 10.1016/j.brainres.2008.05.015
Ethanol-related increases in degenerating bodies in the Purkinje neuron dendrites of aging rats
Abstract
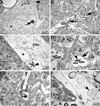
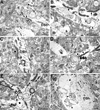
Chronic ethanol consumption in aging rats results in regression of Purkinje neuron (PN) dendritic arbors ([Pentney, 1995 Measurements of dendritic pathlengths provide evidence that ethanol-induced lengthening of terminal dendritic segments may result from dendritic regression. Alcohol Alcohol. 30, 87-96]), loss of synapses (Dlugos and Pentney, 1997), dilation of the smooth endoplasmic reticulum (SER), and the formation of degenerating bodies within PN dendrites ([Dlugos, C.A., 2006a. Ethanol-Related Smooth Endoplasmic Reticulum Dilation in Purkinje Dendrites of Aging Rats. Alcohol., Clin. Exp. Res. 30, 883-891,Dlugos, C.A., 2006b. Smooth endoplasmic reticulum dilation and degeneration in Purkinje neuron dendrites of aging ethanol-fed female rats. Cerebellum. 5, 155-162]). Dilation of the SER and the formation of degenerating bodies may be a predictor of dendritic regression. Ethanol-induced effects on mitochondria may be involved as mitochondria cooperate with the SER to maintain calcium homeostasis. The purpose of this study was to determine whether degenerating body number and mitochondrial density and structure are altered by chronic ethanol treatment in PN dendrites. Male, Fischer 344 rats, 12 months of age, were fed an ethanol or pair-fed liquid diet, or rat chow for a period of 10, 20, or 40 weeks (15 rats/treatment; 45 rats/treatment duration). Ethanol-fed rats received 35% of their calories as ethanol. At the end of treatment, all animals were euthanized, perfused, and tissue prepared for electron microscopy. The densities of degenerating bodies and mitochondria, mitochondrial areas, and the distance between the SER and the mitochondria were measured. Results showed that there was an ethanol-related increase in degenerating bodies compared to controls at 40 weeks. Ethanol-induced alterations to mitochondria were absent. Correlation of the present results with those of previous studies suggest that degenerating bodies may be formed from membrane reabsorption during dendritic regression or from degenerating SER whose function has been compromised by dilation.
Figures


Similar articles
-
Smooth endoplasmic reticulum dilation and degeneration in Purkinje neuron dendrites of aging ethanol-fed female rats.Cerebellum. 2006;5(2):155-62. doi: 10.1080/14734220600697187. Cerebellum. 2006. PMID: 16818390
-
Ethanol-related smooth endoplasmic reticulum dilation in purkinje dendrites of aging rats.Alcohol Clin Exp Res. 2006 May;30(5):883-91. doi: 10.1111/j.1530-0277.2006.00103.x. Alcohol Clin Exp Res. 2006. PMID: 16634858
-
Effects of chronic ethanol consumption on SER of Purkinje neurons in old F344 rats.Alcohol. 2000 Feb;20(2):125-32. doi: 10.1016/s0741-8329(99)00064-6. Alcohol. 2000. PMID: 10719791
-
Neuroinflammation as a neurotoxic mechanism in alcoholism: commentary on "Increased MCP-1 and microglia in various regions of human alcoholic brain".Exp Neurol. 2008 Sep;213(1):10-7. doi: 10.1016/j.expneurol.2008.05.016. Epub 2008 Jul 14. Exp Neurol. 2008. PMID: 18625499 Free PMC article. Review. No abstract available.
-
Mechanisms of ethanol-induced death of cerebellar granule cells.Cerebellum. 2012 Mar;11(1):145-54. doi: 10.1007/s12311-010-0219-0. Cerebellum. 2012. PMID: 20927663 Free PMC article. Review.
Cited by
-
Age-related alterations in histone deacetylase expression in Purkinje neurons of ethanol-fed rats.Brain Res. 2017 Nov 15;1675:8-19. doi: 10.1016/j.brainres.2017.08.026. Epub 2017 Aug 30. Brain Res. 2017. PMID: 28855102 Free PMC article.
-
Augmentation of aluminum-induced oxidative stress in rat cerebrum by presence of pro-oxidant (graded doses of ethanol) exposure.Neurochem Res. 2010 Nov;35(11):1681-90. doi: 10.1007/s11064-010-0230-3. Epub 2010 Jul 18. Neurochem Res. 2010. PMID: 20640917
-
Ethanol-Induced Alterations in Purkinje Neuron Dendrites in Adult and Aging Rats: a Review.Cerebellum. 2015 Aug;14(4):466-73. doi: 10.1007/s12311-014-0636-6. Cerebellum. 2015. PMID: 25648753
-
Animal models of human cerebellar ataxias: a cornerstone for the therapies of the twenty-first century.Cerebellum. 2009 Sep;8(3):137-54. doi: 10.1007/s12311-009-0127-3. Cerebellum. 2009. PMID: 19669387
-
Treatment of Essential Tremor: Are there Issues We are Overlooking?Front Neurol. 2012 Jan 13;2:91. doi: 10.3389/fneur.2011.00091. eCollection 2011. Front Neurol. 2012. PMID: 22275907 Free PMC article.
References
-
- Ahluwalia B, Ahmad S, Adeyiga O, Wesley B, Rajguru S. Low levels of ethanol stimulate and high levels decrease phosphorylation in microtubule-associated proteins in rat brain an in vitro study. Alcohol Alcohol. 2000;5:452–457. - PubMed
-
- Anken R, Ibsch M, Kniesel U, Rahmann H. No correlation between multilamellar bodies in the inner ear and further organs of mutant (backstroke, bks) and wildtype zebrafish embryos. Adv Space Res. 2004;33:1411–1475. - PubMed
-
- Babel J, Bischoff A, Spoendin H. Ultrastructure of the Peripheral Nervous System and Sense Organs. In: Bischoff A, editor. Atlas of Normal and Pathologic Anatomy. Missouri: C.V. Mosby Company; 1970.
-
- Bogolepov NN. Changes in the dendrites in chronic morphine poisoning. Arkh Anat Gistol Embriol. 1981;81:5–11. - PubMed
-
- Breslow RA, Faden VB, Smothers B. Alcohol consumption by elderly Americans. J. Stud. Alc. 2003;64:884–892. - PubMed
Publication types
MeSH terms
Substances
Grants and funding
LinkOut - more resources
Full Text Sources
Medical

